
The Complete Guide to Insurance Analytics
From Descriptive to Predictive Insights: Data, Decisions, and Growth
Inhalt
- 1. Executive Summary
- 2. Fundamentals
- 3. Data Foundations
- 4. Benefits & Business Value
- 5. Types of Analytics
- 6. Roles & Responsibilities
- 7. The Analytics Process
- 8. Challenges & Opportunities
- 9. KPIs
- 10. Governance & Compliance
- 11. Best Practices
- 12. Operating Models
- 13. Workforce
- 14. The Future
- 15. Guidewire Solutions
- 16. Conclusion
Insurance Analytics: From Data to Decisions
Insurance analytics has become a foundational capability for today's property and casualty insurers as risk complexity, regulatory expectations, and competitive pressures continue to increase. If Intelligent Insurance is applying the right information at the right time to inform better actions, insurance analytics is the critical process of transforming raw data into actionable insights, information that can drive better decisions.
Insurance analytics is the systematic application of data, statistical methods, and predictive models to support decision-making across pricing, underwriting, claims management, and fraud detection. In P&C insurance, analytics enables carriers to translate data into insight and insight into action within core operational workflows. And in the world of AI, the structures and disciplines required for effective insurance analytics provide a foundation for insurers to evaluate and implement new capabilities from AI systems into their operations.
Modern insurance analytics spans descriptive, diagnostic, predictive, and prescriptive techniques. Together, these approaches allow insurers to move from raw data to informed decisions by identifying performance drivers, forecasting future outcomes, and recommending optimal actions that correspond with corporate goals. Increasingly, these capabilities are delivered through machine learning and AI-driven models that connect data directly to prediction and decision logic. These decisions may become automated based on model output, or they could remain human choices, aided by information the models provide. When analytics is embedded at the point of decision, it reduces loss volatility, improves underwriting precision, and increases operational efficiency.
Industry analysts consistently report that insurers who operationalize analytics at scale outperform peers on profitability and loss-related metrics. By systematically linking data availability, analytics, and execution, predictive and prescriptive analytics enable a shift from reactive analysis to proactive, real-time decision support—driving measurable loss reduction and sustainable premium growth for P&C carriers.
This document provides a comprehensive overview of insurance analytics. It covers foundational concepts, analytics types, business value, governance and compliance considerations, implementation challenges, operating models, and emerging technologies shaping data-driven insurance operations across the P&C value chain.
Inhalt
- 00Executive Summary: Insurance Analytics in 90 SecondsJump →
- 01Fundamentals: What Is Insurance Analytics?Jump →
- 02Data Foundations: Building the Analytics-Ready Insurance Data LayerJump →
- 03Benefits and Business Value: Why Insurance Analytics MattersJump →
- 04Types of Insurance Analytics: Descriptive, Diagnostic, Predictive, and PrescriptiveJump →
- 05Roles and Responsibilities in Insurance AnalyticsJump →
- 06In Motion: The Analytics Process in InsuranceJump →
- 07Finding Direction: Challenges and Opportunities in Insurance Data AnalyticsJump →
- 08Measuring What Matters: KPIs for Insurance Analytics PerformanceJump →
- 09Staying Aligned: Governance and Compliance in Insurance DataJump →
- 10Shaping Excellence: Best Practices for Analytics in InsuranceJump →
- 11Operating Models: Building and Scaling Insurance Analytics TeamsJump →
- 12Empowering the Workforce: Data Literacy and Change ManagementJump →
- 13Looking Ahead: The Future of Predictive and Prescriptive AnalyticsJump →
- 14From Insight to Action: Guidewire Analytics SolutionsJump →
- 15Conclusion: Insurance Analytics as a Strategic AdvantageJump →
Executive Summary: Insurance Analytics in 90 Seconds
Insurance analytics is the systematic use of data, statistical methods, and predictive models to support decision-making across pricing, underwriting, claims, fraud detection, and customer management. In property and casualty insurance (also known as general insurance), analytics connects data to action by transforming raw data into useful information. This includes translating risk signals into decisions that shape profitability and loss outcomes, as well as analyzing operational data to optimize decisions across an insurer's functions.
Analytics directly influences the financial performance of P&C insurers. Pricing accuracy, loss ratio control, claim severity management, fraud detection, and customer retention all depend on the insurer's ability to anticipate outcomes and act consistently at scale. Insurers with mature analytics capabilities routinely outperform peers on combined ratio, expense ratio, and growth metrics by reducing uncertainty and improving decision quality.
As risk complexity increases, traditional reporting and retrospective analysis are no longer sufficient. But many insurers struggle to operationalize analytics despite significant investment. Common obstacles include fragmented data environments, inconsistent data quality, inefficient modeling processes, limited real-time access to insights, growing regulatory scrutiny of model-driven decisions, and shortages of analytics talent with insurance domain expertise.
Rather than only analyzing results after the fact, leading P&C insurers are embedding analytics directly into core workflows using predictive and prescriptive models supported by machine learning and AI. Analytics is increasingly used to guide underwriting decisions, route claims, detect fraud earlier, and personalize customer interactions in real time. The objective is not analytics maturity for its own sake, but measurable improvement in loss performance, efficiency, and competitive differentiation.
This guide provides a comprehensive overview of insurance analytics, including foundational concepts, data prerequisites, analytics types, organizational roles, lifecycle processes, governance and compliance considerations, performance measurement, operating models, workforce enablement, emerging trends, and the technologies that support analytics-driven insurance operations. It does not cover the analytics involved in determining appropriate reserve levels for insurers, nor does it cover the specific analytics that can be used in investing and asset management. However, many of the ideas and principles will be relevant in these areas as well.
Insurance executives, analytics and data leaders, underwriting and claims operations managers, actuarial teams, technology decision-makers, compliance professionals, and anyone responsible for improving profitability, loss outcomes, or decision consistency in P&C insurance.
A Note About AI
Insurance analytics has always involved artificial intelligence (AI) in the broadest sense of the term: computer algorithms learning from experience (data). Any predictive model with optimized coefficients counts as AI. However, this guide acknowledges that when AI is now used in common language, large language models (LLMs) and generative AI (genAI) is what is meant. When the term "AI" is used in this guide we will be referring to LLMs, genAI and associated technologies (e.g. agents or multi-modal models).
A complete discussion on how to effectively implement AI-based systems is beyond the scope of this guide. For our purposes, AI is considered a tool that will impact how insurance analytics is conducted and implemented.
The impact that modern AI will have on insurance analytics is widespread, but the most likely one is changing the way humans interact with information. LLMs bring an understanding of the human language such that instructions and requests can be given in the form of expressions of intent, what is wanted, rather than in detailed spec documents or lines of code. This allows AI to summarize data and bring it to the fore, which has significant implications for insurance workflows and automation.
However, LLMs and genAI are inherently probabilistic in their output, with no guarantees of the repeatability required for many insurance applications. Their applicability to making the specific predictions typical of traditional statistical and machine learning techniques is questionable. We assume the continued relevance of these techniques. AI may change how actuaries and data scientists go about making predictive models, but it doesn't change the need to create these models and deploy them effectively into insurance workflows.
"AI succeeds when it solves real business problems."
Laura Drabik · Chief Evangelist, Guidewire
In this guide we focus on insurance analytics as a key component of Intelligent Insurance, defined as surfacing the right information at the right time in order to improve decisions. AI will change the workflows of adjusters, underwriters and others, and it may change how the provided information is accessed, but it will not change the need for accurate information at the right time that will improve insurance decisions.
How This Guide Is Structured
This guide is organized around the core lenses through which insurance analytics is designed, deployed, and evaluated. Each major section examines analytics from a specific operational perspective, such as data foundations, analytics methods, decision processes by insurance function (pricing, underwriting, etc.), organizational roles, governance controls, performance measurement, workforce enablement, and technology integration.
Key terms are defined within the context of the section in which they appear. A concept may therefore be explained differently across sections, reflecting its distinct role in analytics execution, governance, performance management, or organizational design. These definitions are intentionally contextual rather than abstract.
Throughout the guide, definitions and explanations emphasize:
- when a concept becomes relevant,
- how it operates within insurance workflows, and
- what outcomes it produces for insurers, customers, and regulators.
Insurance analytics is a system of interconnected data, models, decisions, and controls—not a collection of isolated techniques. The organization of this guide reflects that reality and is designed to support consistent reasoning across operational, strategic, and technical considerations.
Fundamentals: What Is Insurance Analytics?
Insurance analytics is the discipline that connects insurance data to decision-making across the property and casualty value chain. It encompasses the systematic use of statistical analysis, predictive modeling, and decision logic to inform pricing, underwriting, claims management, fraud detection, and customer engagement. In P&C insurance, analytics provides the mechanism by which raw data is transformed into consistent, repeatable, and auditable business decisions.
At its core, insurance analytics answers four fundamental questions that guide both operational execution and strategic planning:
- What happened? (Descriptive analytics)
- Why did it happen? (Diagnostic analytics)
- What is likely to happen next? (Predictive analytics)
- What is the best course of action? (Prescriptive analytics)
These analytics types function as a continuum rather than isolated capabilities. Descriptive reporting establishes baselines and operational visibility. Diagnostic analysis provides context by explaining drivers and correlations. Predictive models quantify future outcomes and opportunities. Prescriptive analytics operationalizes insight by guiding actions such as pricing adjustments, claim routing, or fraud investigation. And in circular fashion, descriptive analytics monitors the impact of changed (improved!) business processes. When combined, these capabilities reduce uncertainty and variability across insurance operations.
Modern insurance analytics operates on integrated data environments that draw from core policy, billing, and claims systems, supplemented by external data sources such as property intelligence, geospatial risk indicators, and behavioral signals. Governance controls ensure data quality and consistency before analytics outputs are delivered through dashboards, decision engines, or embedded workflows. This integration allows insights from analytics to be delivered at the right time, and to function as an active component of daily operations rather than a retrospective reporting function.
Too many make the mistake of focusing on technical challenges rather than the strategic questions of where to apply analytics as the solution to their business problems.
Chris Cooksey · Senior Director of Advanced Analytics, Guidewire
As outcomes are observed, analytics systems incorporate feedback to refine future decisions. Machine learning techniques enable models to be recalibrated as new data becomes available, improving accuracy over time. This creates a circular analytics capability in which decisions are informed by prior results, reinforcing performance improvement across underwriting, claims, and customer management.
Insurance analytics delivers the greatest value when it informs human and automated decisions. This requires that it be embedded directly into core operational systems. Rather than existing as standalone tools, analytical insights are integrated into insurance pricing, underwriting workbenches, claims workflows, and customer service platforms. This embedded approach supports automation where appropriate, as well as auditability and scale—ensuring that analytics-driven decisions are applied consistently at the point of execution, and in a way that builds trust.
Top Terms in Insurance Analytics Fundamentals
What is it? The systematic use of data, statistical methods, and models to generate insights and information that support insurance decisions. When is it relevant? Across the insurance lifecycle, from marketing, sales and distribution, to underwriting and pricing, and through to claims management, portfolio management, and customer renewals. What does it do? Transforms data into information, insights and recommendations. What outcome does it create? More accurate, consistent, and profitable insurance decisions. Examples Using expected loss models to inform insurance pricing, or claims models to guide efficient claims handling. What is it? Analysis that summarizes historical and current insurance data. When is it relevant? During operational monitoring, reporting, and governance activities. What does it do? Establishes visibility into performance metrics and trends. What outcome does it create? A factual baseline for accountability and oversight, and a shared understanding of what has occurred. Examples Dashboards tracking claim frequency and loss ratio trends. What is it? Analysis that explains why outcomes occurred. When is it relevant? When performance deviates from expectations. What does it do? Identifies drivers, correlations, and root causes. What outcome does it create? Insight into performance variability. Examples Analyzing loss ratio deterioration by geography. What is it? Statistical and machine learning techniques that use patterns in the data to forecast likely future outcomes. When is it relevant? Before decisions are made, especially when foreknowledge of the outcome would affect the decision made. What does it do? Estimates probabilities and expected values of future events. It informs a decision-maker of what is more or less likely to happen. What outcome does it create? Reduced uncertainty and improved anticipation of risk and opportunity. Examples Predicting claim severity at first notice of loss. What is it? Analytics that recommends or automates actions based on predictions. When is it relevant? At the point of decision execution within insurance workflows. What does it do? Guides or automates optimal actions, reflecting corporate direction based on the predicted information. What outcome does it create? Improved decision execution and measurable performance gains. Examples Routing claims to fast-track or special investigation. What is it? A mathematical or statistical representation of the patterns found in data. When is it relevant? Whenever analytics is embedded into workflows or otherwise operationalized. What does it do? Translates known data inputs into output predictions or scores. What outcome does it create? Quantified insight into risk or performance. Examples A loss frequency model that takes years in business, location, and square footage (i.e. known data) as inputs, and provides an expected change of having a claim. What is it? Analytics that is integrated directly into operational systems. When is it relevant? During real-time underwriting, claims, or service workflows. What does it do? Delivers insights at the point of action. What outcome does it create? Faster and more consistent execution. Examples Severity scores displayed in claim intake screens. What is it? The use of analytics to automatically execute decisions. When is it relevant? For high-volume, low-complexity decisions. What does it do? Reduces manual intervention. What outcome does it create? Lower cost and faster cycle times. Examples Automatic claim assignment based on risk score. What is it? The output of a predictive model providing an estimate of the likelihood and impact of future loss events. When is it relevant? During pricing, underwriting, and claims triage. What does it do? Quantifies uncertainty, through the use of probabilities and expectations. What outcome does it create? Better alignment between risk and premium, risk and underwriting decisions, or claim severity and claim handling. Examples Predicting hail loss probability for property risks. What is it? An application of predictive analytics designed to identify suspicious or anomalous behavior. When is it relevant? During claims submission and review. What does it do? Flags high-risk transactions for referral or investigation. What outcome does it create? Reduced leakage and improved loss control. Examples Network analysis identifying collusive claim patterns.
Data Foundations: Building the Analytics-Ready Insurance Data Layer
Insurance analytics depends on the availability, quality, and structure of data long before models are built or insights are delivered. Having solid foundations for how an insurer handles, collects, stores and accesses data is critical, and forms connective tissue between operational systems and analytical decision-making. Operational systems generate the data that analytics needs access to in order to generate insights. Without a reliable data layer, analytics initiatives struggle to produce consistent, trustworthy outcomes, regardless of model sophistication.
An analytics-ready insurance data layer integrates core internal data sources, including policy, billing, claims, and customer information, with relevant external data such as property characteristics, geospatial risk indicators, weather history, and socioeconomic signals. This data must be standardized, governed, and continuously validated to ensure it reflects real-world exposure and operational reality. Fragmented systems, inconsistent definitions, and incomplete records introduce friction that limits the effectiveness of downstream analytics.
The data layer must facilitate two separate use cases for insurance analytics. One is to store historical transactions so that this data can be used for analysis and model-building. Data structures for efficient daily processing are different from those used for efficient storage, and both of these are different from how data is structured for analytics. An analytics-ready data layer facilitates these structural transitions to make data easily accessible for analytics projects.
Another use case is to provide data as inputs to operationalized predictive models in real-time workflow environments, in order for those models to provide predictions. Data structures for this application are the same as those for daily processing, except that the predictive models may require additional fields and data transformations.
| Historical / Analytics Storage | Real-Time Operational Inputs | |
|---|---|---|
| Purpose | Store historical transactions for analysis and model-building. | Provide data as inputs to operationalized predictive models so they can generate predictions. |
| Data structure | Structured for efficient analytics access — distinct from both daily-processing and storage formats. | Same structure as daily processing, with additional fields and transformations the models require. |
| Operating context | Analysis and model-building projects. | Real-time workflow environments. |
Modern insurers must design data foundations and use tools that support both the creation of and real-time use of analytical models. A well-architected data layer balances these needs, ensuring data is accessible at the speed required by the decision it supports.
Data quality in both use cases directly influences the accuracy of predictive and prescriptive analytics. Missing attributes, delayed ingestion, or poorly aligned data definitions can distort or limit loss forecasts, pricing signals, and claim severity estimates. Equally important is data representativeness. If certain geographies, risk types, or customer segments are underrepresented or inconsistently captured, analytics outputs may reinforce blind spots rather than reveal insight.
"The first component is data. Data is at the center of the challenge and the opportunities set before insurers..."
Chris Cooksey · Senior Director of Advanced Analytics, Guidewire
Data bias is a foundational challenge in insurance analytics. Bias can emerge when historical data reflects legacy underwriting practices, uneven claims handling, or structural gaps in data collection. Left unaddressed, these biases propagate through analytics pipelines, leading to skewed risk assessments, suboptimal pricing decisions, and unintended disparities in outcomes. Addressing data bias at the foundation stage through identification, mitigation, and continuous monitoring is essential to producing analytics that support both business performance and responsible decision-making.
Ultimately, strong data foundations enable a clear causal chain: reliable historical data feeds analytics; analytics using operational data informs decisions; decisions drive outcomes. When insurers invest in analytics-ready data foundations, they reduce uncertainty, improve loss predictability, and create the conditions for sustained profitability and disciplined growth.
Top Data Foundation Terms in Insurance Analytics
What is it? The structured collection of facts and statistics for reference or analysis. It includes records of all transactions for the insurer. When is it relevant? Before analytics models are developed or insights are embedded into operational workflows. What does it do? Provides a record of all transactions for the insurer. Provides information about risks insured and the environment in which the insurer operates. What outcome does it create? If organized and made accessible, reliable information for analytics. Examples Policy, claims, and billing data, or information about the insured risks. What is it? The comprehensive understanding of an insurer's data. It is a model for how to understand the insurer's data. When is it relevant? When developing the strategy for how to organize and handle data. What does it do? Defines what data means and how it is structured for different purposes. What outcome does it create? A unified understanding of what data means, how it is structured and organized, and how it might be used. Examples Data definitions, maps of data flows, descriptions of data organization. What is it? Part of the insurer's system architecture that organizes data storage and flow. When is it relevant? When storing data and accessing it for daily operations, external reporting, and analytics. What does it do? Captures and organizes the insurance data that inform analytics. What outcome does it create? A coherent understanding of the role of data within the insurer's system architecture. Examples Data lakes or warehouses, data definitions, data model. What is it? Specific repositories of data that may be accessed for analytics. When is it relevant? When determining the data to support an analytics project. Data may need to come from different sources and be combined. What does it do? Stores and organizes data making it available for specific purposes. What outcome does it create? Accessibility to different types of data. Examples Policy tables, claim tables, external data repositories. What is it? The organization and format of data. When is it relevant? During data flows and data storage. What does it do? Defines how the data is organized, what each datum means and how it relates to other data. What outcome does it create? Clear understanding of what data means, what it can be used for, and how it might be transformed for other purposes. Examples Relational databases, flat files, normalized and de-normalized data. What is it? Data generated by an insurer's core operational systems. When is it relevant? During underwriting, claims handling, billing, and customer servicing, and during insurance analytics. What does it do? Captures exposure, transactions, and outcomes that inform analytics. What outcome does it create? Visibility into performance, risk selection, and loss drivers. Examples Claim severity histories, policy attributes, payment timelines. What is it? Third-party data sources used to enrich internal insurance data. When is it relevant? At underwriting, pricing, fraud detection, and risk assessment stages, and during insurance analytics. What does it do? Adds contextual signals that are not available from internal systems alone. What outcome does it create? More accurate risk differentiation and better insurance decisions. Examples Property hazard data, weather history, telematics signals. What is it? Data that supports the daily operations of an insurance company. When is it relevant? During sales, underwriting, pricing, claims adjusting, customer service, and any other daily function of an insurance company. What does it do? Makes available the information needed to run an insurance company. What outcome does it create? Efficient processes and smooth customer experiences. Examples Insured/prospect address, policy number, loss date. What is it? Data from previous insurance transactions. When is it relevant? During insurance analytics, which requires significant volumes of data. What does it do? Makes available collections of previous insurance transactions. What outcome does it create? Insurance analytics. Examples Data lakes or warehouses, relational databases, normalized data. What is it? Data that has been cleansed, structured, and governed for analytical use. When is it relevant? Data preparation for insurance analytics. What does it do? Makes available data for analytical tools and algorithms. What outcome does it create? Faster deployment of analytics use cases. Examples Flat files, de-normalized data, curated datasets. What is it? The accuracy, completeness, and consistency of insurance data. When is it relevant? Continuously, across ingestion, analysis, and reporting. What does it do? Ensures analytics outputs reflect real-world conditions. What outcome does it create? Improved trust in analytics-driven decisions. Examples Validated claim amounts, standardized coverage codes. What is it? The process of aligning data definitions and formats across systems. When is it relevant? When integrating data from multiple core platforms or vendors. What does it do? Enables consistent analytics and reporting. What outcome does it create? Reduced ambiguity and faster insight generation. Examples Harmonized loss cause codes across claim systems. What is it? Systematic distortion in data caused by historical, structural, or collection-related factors. When is it relevant? During data preparation and analytics model development. What does it do? Skews analytics outputs if left unaddressed. What outcome does it create? Inaccurate risk assessments and inconsistent outcomes. Examples Underrepresentation of certain regions or customer segments in historical data.
Benefits and Business Value: Why Insurance Analytics Matters
The business of insurance is not to create data or to facilitate analytics. If insurance analytics does not meaningfully improve business outcomes, it is simply an unjustified expense.
Insurance analytics creates business value by improving the quality, speed, and consistency of decisions across the property and casualty insurance value chain. In P&C insurance, profitability, loss performance, and customer outcomes are shaped by thousands of daily decisions—from pricing and risk selection to claims triage and settlement. Analytics enables insurers to operationalize insight at these decision points, transforming data into measurable financial and operational improvement.
When analytics is embedded across these decision points and reinforced through continuous feedback, insurers move toward intelligent insurance operations—where insight is systematically translated into action across underwriting, claims, and customer engagement.
At an operational level, analytics is costly and does not create value directly. Value is realized when analytics improves how decisions are made and executed. By reducing uncertainty, standardizing judgment, and enabling proactive action, insurance analytics strengthens underwriting discipline, controls loss costs, and improves operational efficiency. This decision-centric impact is what differentiates analytics leaders not only from peers that rely primarily on retrospective reporting or manual judgment, but also from those who invest in analytics without realizing value.
Industry research consistently shows a strong correlation between advanced analytics adoption and superior financial performance in P&C insurance. According to analysis by McKinsey & Company, insurers that embed advanced data and analytics into underwriting and operational processes can achieve loss ratio improvements of three to five points, new business premium growth of 10–15 percent, and retention gains of 5–10 percent in profitable segments. These gains are driven by more accurate risk selection, earlier intervention, and tighter execution—not by analytics in isolation.
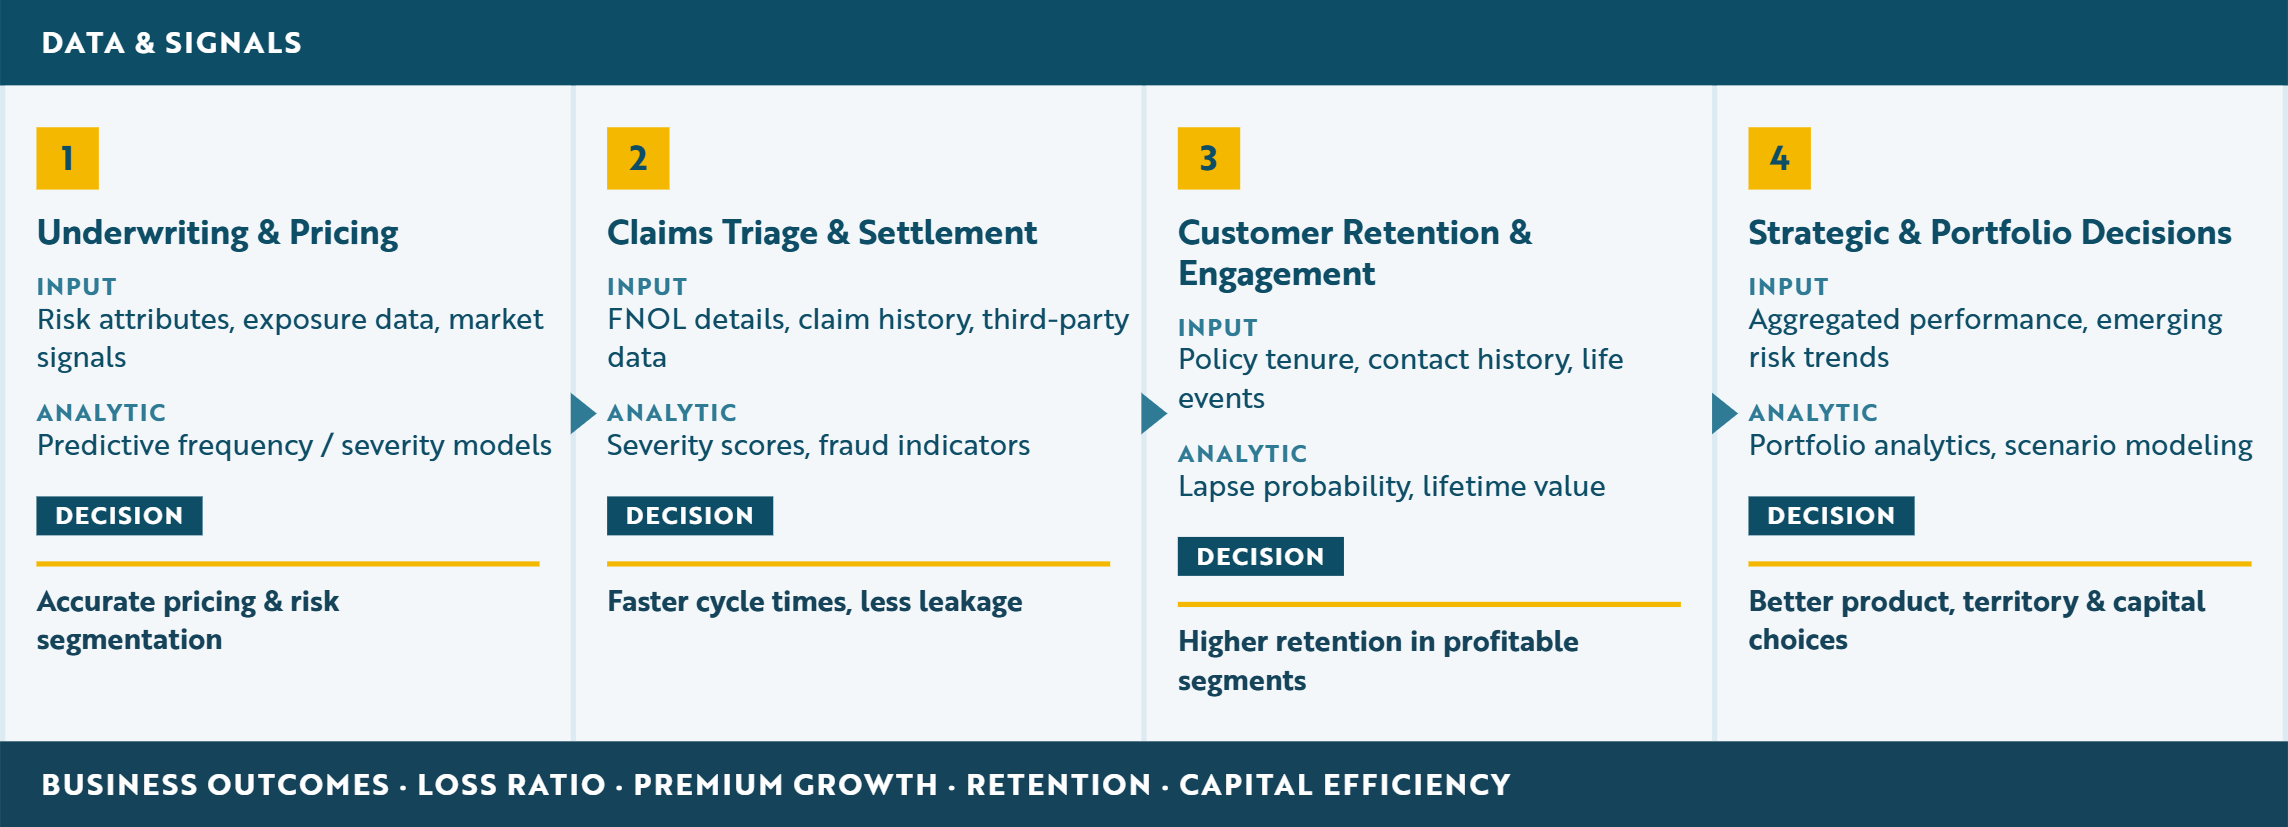
Insurers apply analytics at several high-impact decision points, each of which are discussed in more detail in following chapters:
- Underwriting and Pricing Decisions. Predictive models estimate expected loss frequency and severity, enabling more accurate pricing and risk segmentation. Analytics supports consistent application of underwriting guidelines and improves alignment between premium and exposure.
- Claims Triage and Settlement Decisions. Severity scores, fraud indicators, and workflow analytics guide claim routing, settlement strategy, and resource allocation. This improves cycle time, reduces leakage, and supports fair, timely outcomes.
- Customer Retention and Engagement Decisions. Predictive analytics can inform marketing decisions, as well as estimate lapse probability and customer lifetime value for existing customers. This enables proactive outreach and personalized renewal strategies that improve retention in profitable segments. Analytics can provide information about agent effectiveness and performance to improve distribution.
- Strategic and Portfolio-Level Decisions. Aggregated analytics informs product design, territory expansion, reinsurance strategy, and capital allocation by revealing emerging risk trends and performance patterns.
The cumulative effect of these improvements is both tactical and structural. Analytics-driven insurers reduce loss volatility, improve expense discipline, and adapt more effectively to changing risk environments. Over time, this compounds into sustained competitive advantage through more predictable profitability and faster response to market shifts.
"The predictive model is just one piece of a holistic effort to solve a problem. Centering on the business problem, not just the model, is the right approach."
Chris Cooksey · Senior Director of Advanced Analytics, Guidewire
Analytics produces information, but Intelligent Insurance runs on decisions. Insurance analytics delivers the greatest business value when embedded directly into core systems where decisions are executed. When analytics is integrated into underwriting, claims, and customer service workflows, insights are applied consistently and in real time—reducing delays, limiting manual overrides, and improving auditability. This embedded execution model is what allows analytics to scale from isolated use cases to enterprise-wide performance improvement.
Top Terms to Know in Benefits of Insurance Analytics
What is it? The measurable operational and financial metrics for the insurer. When is it relevant? In measuring the effectiveness of insurance operations. What does it do? Measures the financial health and operational efficiency of the insurer. What outcome does it create? Information on the financial health and operational efficiency of the insurer. Examples Combined ratio, new business close rates, average time to close a claim. What is it? The process of determining and implementing the price charged for insurance. When is it relevant? At quote, bind, and renewal for implementation, during insurance analytics in the creation/modification of the rating plan. What does it do? Ensures that the prices are not inadequate, not excessive, and not unfairly discriminatory. What outcome does it create? Competitive pricing that generates enough income to ensure financial stability. Examples Rating plan creation, rate deployment. What is it? The process of determining which risk to underwrite insurance for. When is it relevant? At quote, bind, renewal, and portfolio review stages. What does it do? Identifies the target customers the insurer wants to write. What outcome does it create? Written books of business that reflect corporate goals for the market to write. Examples Commercial underwriting, personal lines underwriting rules. What is it? Discrimination between insureds that represent different risks of loss. When is it relevant? During insurance pricing and risk selection. What does it do? Identifies which customers should be charged higher or lower premium. What outcome does it create? Prices that reflect risk without cross-subsidization. Examples Personal lines rating plans, commercial rates reflecting different risks. What is it? Efficient and effective execution of the insurer's underwriting strategy. When is it relevant? At quote, bind, renewal, and portfolio review stages. What does it do? Ensures that risks are selected, priced and underwritten according to corporate goals. What outcome does it create? Sustainable market presence and profitable performance. Examples Underwriting rules and processes, reviews of underwriter performance. What is it? The use of analytics to improve claims handling efficiency and outcomes. When is it relevant? From first notice of loss through settlement. What does it do? Guides triage, investigation, and settlement decisions. What outcome does it create? Reduced cycle time, lower leakage, and improved customer satisfaction. Examples Routing high-severity claims to senior adjusters using predictive scores. What is it? Paying more for a claim than an insurer is obligated to pay. When is it relevant? From first notice of loss through settlement. What does it do? Increases loss costs and reduces profitability. What outcome does it create? Results in the insurer making claim payments they should not be making. Examples Unidentified fraud, poor claim adjusting. What is it? Claims paid plus adjustment expenses divided by earned exposures. It is also defined as the claim frequency multiplied by the claim severity. When is it relevant? In performance measurement and insurance pricing. What does it do? Indicates the cost of insured losses per exposure. Does not measure expenses not allocated to the specific claim. A loss cost of $1000 indicates that the average claim payment for every unit of exposure is $1000. What outcome does it create? Visibility into insurance pricing and loss control effectiveness. Examples Analyzing loss costs to determine insurance prices, tracking loss costs for claim department performance. What is it? The ability to deliver insurance services with minimal cost and delay. When is it relevant? Across underwriting, claims, billing, and service operations. What does it do? Reduces friction and manual effort in insurance processes. What outcome does it create? Lower expense ratios and faster service delivery. Examples Automating low-complexity claims using analytics-driven rules. What is it? The chance that a current customer will not renew their policy. When is it relevant? Customer service, portfolio management, insurance pricing. What does it do? Reflects customer satisfaction with prices and service, as well as brand loyalty. What outcome does it create? Visibility into how an insurer's book of business evolves. Examples Analytics models predicting lapse probability.
Types of Insurance Analytics: Descriptive, Diagnostic, Predictive, and Prescriptive Analytics
Insurance analytics is best understood as a decision loop, not a collection of standalone techniques. The process is not strictly linear or circular, but generally moves forward by cyclically using different types of analytics to surface information to improve decisions. Insurance analytics is thought of as a closed loop when new actions based on analytics are monitored and reviewed so as to refine the next round of analytics.
Descriptive, diagnostic, predictive, and prescriptive analytics work together to transform data into decisions and decisions into outcomes across the property and casualty insurance lifecycle. Each analytics type answers a distinct question, and value is realized when all four operate to reinforce one another.
Framed as a decision loop, the four types of insurance analytics function as follows:
| Analytics type | Question it answers | What it does |
|---|---|---|
| Descriptive analytics | What happened? | Establishes visibility into historical performance and current state. |
| Diagnostic analytics | Why did it happen? | Explains drivers, correlations, and root causes behind observed outcomes. |
| Predictive analytics | What is likely to happen next? | Estimates future risk, behavior, or performance before decisions are made. |
| Prescriptive analytics | What is the best course of action? | Recommends or executes actions that optimize business outcomes. |
Predictive analytics is not “one and done.” Outcomes generated by prescriptive decisions feed back into descriptive measurement, enabling ongoing refinement and control.
Descriptive Analytics: Establishing Operational Visibility
Descriptive analytics summarizes historical and current data to provide a factual baseline for decision-making. In P&C insurance, this includes metrics such as claim frequency, loss ratio trends, quote conversion rates, expense ratios, and customer engagement levels. Descriptive insights support operational monitoring, regulatory reporting, and performance benchmarking by answering what has occurred and where performance stands today.
To draw an analogy to rafting down a river, descriptive analytics is looking around at the surface of the water. It tells you where you are, how close to the banks of the river, how fast the water is moving and if it is accelerating, etc.
Typical outputs include dashboards, standard reports, and visualizations that track key performance indicators across underwriting, claims, billing, and service operations. While descriptive analytics does not drive decisions directly, it is essential for perspective on the current state of operations and the effectiveness or impact of prior actions taken. It plays a valuable role in evaluation, as well as transparency, accountability, and governance.
Diagnostic Analytics: Explaining Performance Drivers
Diagnostic analytics builds on descriptive insight by attempting to explain why outcomes occurred. It identifies contributing factors, relationships, and patterns that influence performance. In insurance operations, diagnostic analytics is used to analyze loss ratio deterioration, identify claim severity drivers, understand pricing variance, or explain differences in performance across regions, products, or customer segments.
In the rafting analogy, diagnostic analytics looks under the water to identify the shape of the riverbed that guides the flow of water, as well as the placement of rocks and other obstacles that disrupt that flow.
This layer relies on techniques such as segmentation, correlation analysis, drill-down exploration, and comparative analysis. Diagnostic analytics supports intervention decisions by revealing where processes, assumptions, or behaviors are related to unfavorable results.
Predictive Analytics: Anticipating Future Outcomes
Predictive analytics estimates what is likely to happen next by applying statistical and machine learning models to historical and current data. In P&C insurance, predictive models forecast outcomes such as claim frequency and severity, fraud probability, customer churn, litigation risk, or renewal likelihood.
In the rafting analogy, predictive analytics gathers what information is known, such as the geology of the area, prior weather patterns, and current forecasts, to predict the state of the river beyond the upcoming bend.
Predictive outputs — often expressed as scores or probabilities — inform decisions before they are executed. Underwriters use predictive insights to assess risk at quote or renewal. Claims teams use them to anticipate complexity or severity early in the lifecycle. Predictive analytics reduces uncertainty by quantifying future exposure and opportunity.
Prescriptive Analytics: Driving Action and Execution
Prescriptive analytics attempts to determine what should be done. It translates predictive insight into recommended or automated actions, such as routing a claim to a specific handling path, applying pricing adjustments, triggering fraud investigation, or initiating targeted customer outreach.
In the rafting analogy, prescriptive analytics tells you where you might want to position the raft (i.e. in the middle, toward the far bank, etc.) to best handle what may be around the coming bend in the river.
Prescriptive analytics is more than the operational framework for implementing decisions based on information from insurance analytics. As critical as this framework is for achieving value, it can be enhanced with analytics exploring the expected effectiveness or impact of different possible decisions. This is prescriptive analytics.
Prescriptive analytics operates within defined business rules, optimization frameworks, and governance constraints to ensure consistency and control. When embedded into core systems, prescriptive analytics enables real-time execution at scale — turning insight into action without delay.
Why the Closed Loop Matters
Insurers derive the greatest value when all four analytics types operate together. Descriptive and diagnostic analytics provide understanding, but predictive and prescriptive analytics drive outcomes. Without prescriptive execution, insight remains informational. Without feedback into descriptive measurement, decisions cannot be refined.
By aligning descriptive, diagnostic, predictive, and prescriptive analytics within core systems, insurers improve decision accuracy, reduce variability, and capture value from each transaction — strengthening both operational execution and strategic planning.
Top Terms to Know in Insurance Analytics Types
What is it? Analysis that summarizes historical and current insurance data. When is it relevant? During operational monitoring, reporting, and governance activities. What does it do? Establishes visibility into performance metrics and trends. What outcome does it create? A factual baseline for accountability and oversight, and a shared understanding of what has occurred. Examples Dashboards tracking claim frequency and loss ratio trends. What is it? Analysis that explains why observed outcomes occurred. When is it relevant? When performance deviates from expectations or requires intervention. What does it do? Identifies drivers, correlations, and root causes of results. What outcome does it create? Insight into where and why performance issues arise. Examples Analyzing factors contributing to high claim severity in a region. What is it? Statistical and machine learning techniques that use patterns in the data to forecast likely future outcomes. When is it relevant? Before decisions are made, especially when foreknowledge of the outcome would affect the decision made. What does it do? Estimates probabilities and expected values of future events. It informs a decision-maker of what is more or less likely to happen. What outcome does it create? Reduced uncertainty and improved anticipation of risk and opportunity. Examples Predicting claim severity at first notice of loss. What is it? Analytics that recommends or automates actions based on predictions. When is it relevant? At the point of decision execution within insurance workflows. What does it do? Guides or automates optimal actions, reflecting corporate direction based on the predicted information. What outcome does it create? Improved decision execution and measurable performance gains. Examples Routing claims to fast-track or special investigation. What is it? A closed cycle of descriptive, diagnostic, predictive and prescriptive analytics linking insight, decision, action, and outcome. When is it relevant? Across the full insurance analytics lifecycle. What does it do? Ensures decisions are continuously informed and refined. What outcome does it create? Sustained improvement through feedback and recalibration. Examples Using claim outcomes to retrain severity prediction models. What is it? Number of claims divided by earned exposures. When is it relevant? In performance measurement and insurance pricing. What does it do? Indicates the likelihood of a claim happening per exposure. A frequency of 10% indicates that for every unit of exposure, there is a 10% chance that a claim will be filed. What outcome does it create? Visibility into insurance pricing and loss control effectiveness. Examples Measuring the effectiveness of a loss prevention initiative. What is it? Claims paid plus adjustment expenses divided by the number of claims. When is it relevant? In performance measurement and insurance pricing. What does it do? Indicates the cost of insured losses per claim. Does not include expenses not allocated to the specific claim. A severity of $2,500 indicates that the average claim payment for every claim is $2,500. What outcome does it create? Visibility into insurance pricing and loss control effectiveness. Examples Measuring severity trends over time to forecast future costs. What is it? Insured losses divided by earned premium. When is it relevant? In performance measurement. What does it do? Indicates the portion of premium earned that is spent on insured losses. A loss ratio of 65% indicates that 65 cents out of every dollar of premium is used to pay losses. What outcome does it create? Visibility into insurance profitability with respect to losses. Examples Measuring loss ratio across regions to identify unprofitable areas. What is it? A statistical technique that identifies when certain things (e.g. values, outcomes, events) occur together. When is it relevant? During diagnostic, predictive and prescriptive analytics. What does it do? Correlated fields indicate a possible connection. What outcome does it create? Better insights into how certain outcomes occur (diagnostic analytics), which when used within formal modeling frameworks can inform predictions (predictive analytics) and recommendations (prescriptive analytics). Examples A correlation between geographic region and average age indicates that there are patterns on where older and younger people live. What is it? A form of analysis where subsets of the data are looked at to determine differences in their performance from the whole data. This includes subsets of subsets, hence the image of “drilling down” into the data. Drill-down exploration is typically a manual activity. When is it relevant? During descriptive and diagnostic analytics. What does it do? Provides information on the characteristics of smaller parts of the whole data. What outcome does it create? Insight into the characteristics and performance of individual segments of the data. Examples Looking at claim frequency for the company as a whole, and then for a single region, and then for a single class within that region. What is it? A form of analysis where different segments of the data are compared. Comparative analysis is typically a manual activity. When is it relevant? During descriptive and diagnostic analytics. What does it do? Provides information on how different parts of the data compare to each other, or to the whole data. What outcome does it create? Insight into the relative make-up or performance of different parts of the data. Examples Comparing the claim severity across the different regions of a book of business. What is it? Predictive modeling techniques that attempt to relate predictor variables with the target outcome. Statistical models typically have coefficients that are optimized using machine learning techniques, hence the modern interchangeability of the terms. When is it relevant? During predictive and prescriptive analytics. What does it do? Creates predictive models that provide not only predictions but the justifications and proof that they are reliable. What outcome does it create? A predictive model. Examples Linear model, generalized linear model (GLM), generalized additive model (GAM). What is it? Predictive modeling techniques that use machine learning. Machine learning is a form of AI that learns patterns in large datasets. Though the phrase “machine learning models” does include statistical models along with other techniques from the field of computer science, specifying both “statistical and machine learning models” provides clarity on what is being referenced. When is it relevant? During predictive and prescriptive analytics. What does it do? Creates predictive models that provide not only predictions but the justifications and proof that they are reliable. What outcome does it create? A predictive model. Examples Statistical models, tree-based techniques, gradient boosting machines, random forests, neural networks. What is it? A number representing the output of a predictive model. The score is a translation of the prediction into a form that can be more appropriate in some cases. When is it relevant? When the relative prediction is more important than the specific prediction. What does it do? Makes predictive output more useful in some cases. Scores are often more useful for non-technical end users as they automatically provide the context of whether a result is high or low. What outcome does it create? A score that has a range (e.g. 1–10, 1–100, 0–999) indicating higher and lower predictions. Examples Credit score, where having relatively high credit or low credit is more useful for the end user than knowing they have a 15% chance of an insured claim.
Roles and Responsibilities in Insurance Analytics
Insurance analytics is not owned by a single team or function. It is a cross-functional activity that depends on clearly defined ownership, accountability, and collaboration across executive, business, technical, and operational roles. Across the insurance industry, analytics initiatives most often fail not because of insufficient data or models, but because decision rights and responsibilities are unclear across the analytics lifecycle.
The different roles described here do not simply align with the phases of the insurance analytics lifecycle described in the next section. While the importance of the roles does change across the phases, and a simplistic view can line up each phase with a role, well functioning insurance analytics typically involves each role in some way in almost every stage. Analytics translators or “two sport stars” that can bridge communication gaps between teams are especially valuable.
Decisions are made during each stage of the analytics lifecycle. Clarity in the roles and responsibilities involves defining which role has decision authority and which other roles advise and provide important input.
Note that different insurers have different structures with roles of different titles and responsibilities. What is important is that insurers clearly understand who is playing what role. Here we describe common titles and their responsibilities with respect to insurance analytics. Successful insurers organize analytics responsibilities across six core accountability layers:
1. Strategy and Enterprise Accountability
Roles at this layer define why analytics exists and how value is measured.
| Role | Responsibilities |
|---|---|
| Chief Data and Analytics Officers (CDAO) / Chief Data Officers (CDO) | Own enterprise analytics strategy, data and analytics governance, and alignment between analytics investments and business objectives. Establish standards, funding priorities, and accountability for outcomes. |
| Executive and Line-of-Business Leaders | Set risk appetite, profitability targets, and strategic priorities. Use analytics outputs to guide growth, portfolio management, and capital allocation decisions. |
| Enterprise Risk Management | Document and manage the risks associated with the use of AI and predictive models, and reliance on vendors. Conduct audits for period checks that are critical to governance. |
This layer decides what analytics activities are funded, and ensures analytics initiatives are anchored to business outcomes rather than isolated technical success. Roles at this layer benefit from the input and expertise of analytical, IT, and operational experts who can inform them of the consequences of competing options.
2. Data and Technical Architecture
Roles at this layer are responsible for building the data capability.
| Role | Responsibilities |
|---|---|
| Data Engineers and Architects | Design and maintain data structures for quote/bind, policy management, billing, claim adjustment and settlement, data storage, analytics, and external reporting. Design and maintain data pipelines and integration frameworks that allow data to flow between these structures. Ensure data availability, quality, scalability, and performance across internal and external sources. |
| Software Architects | Help select and maintain software used for business intelligence (descriptive and diagnostic analytics) and predictive modeling (predictive and prescriptive analytics). Ensure the security and performance of these tools based on the feedback and requirements of users. |
This layer ensures that data is consistent and available in the right format for various needs, and that tools are available for the extraction, analysis, and reporting of that data.
3. Model Research, Development and Maintenance
Roles at this layer are responsible for building the statistical and machine learning models used in insurance analytics.
| Role | Responsibilities |
|---|---|
| Data Scientists and Actuarial Modelers (Predictive Modelers) | Develop predictive and prescriptive models for underwriting, pricing, claims, fraud detection, and customer analytics. Validate assumptions with domain experts and ensure models are fit for purpose. |
| Business Analysts | Review performance through descriptive and diagnostic analytics. Provide monitoring of operational analytics to ensure consistent performance over time. |
This layer transforms raw data into reliable analytical assets and monitors those assets.
4. Decision Design and Translation
Roles at this layer connect analytics to real-world decisions.
| Role | Responsibilities |
|---|---|
| Domain SMEs and UX | Subject matter experts (SMEs) and user experience professionals (UX) translate analytical insights into decision logic, rules, and workflows that are accessible and understandable for front-line users. Bridge business context and technical outputs. Ensure analytics recommendations align with operational realities, regulatory constraints, and customer expectations. |
| Education and Training Professionals | Develop educational and training materials for users of predictive analytics. Ensure the correct and informed use of the information provided. |
This layer ensures analytics is usable, interpretable, and relevant.
5. Business Operations
Roles at this layer apply analytics at the point of action and are responsible for results.
| Role | Responsibilities |
|---|---|
| Line-of-Business Executives and Operations Leaders | Translate executive priorities to operational initiatives. Execute analytics-driven decisions in real time, requiring engagement with training and the use of new workflows. Collect and pass on feedback from front-line users and domain SMEs on decision effectiveness and usability. |
| Front-line Users and Domain SMEs | Use analytics insights to improve insurer performance. Identify unintended consequences and report on difficulties in using the predictive information and new workflows. Ensure that insurance analytics is not used blindly. |
This layer is where analytics directly influences loss outcomes, expense efficiency, and customer experience.
6. Oversight, Governance, and Feedback
Roles at this layer ensure control, trust, and continuous improvement.
| Role | Responsibilities |
|---|---|
| IT and Core Systems Teams | Support auditability and provenance of data, as well as model deployment, versioning, auditability, and system reliability. Ensure system security for all operational deployments. |
| Risk, Compliance, and Governance Functions | Oversee model validation, fairness, explainability and regulatory compliance. Work with analytics teams to provide proactive advice, internal challenge and review. Work with internal ERM to manage the risks from insurance analytics. |
This layer supports analytics by requiring compliance to standards and managing risk.
When these roles operate in isolation, analytics initiatives stall. When they are aligned to clear decision ownership, insurers achieve higher adoption, faster execution, and stronger return on analytics investment.
Top Terms to Know in Analytics Roles
What is it? Coordinated work across business and technical teams. Cross-functional refers to activity that involves multiple business functions for an insurer, such as executive, underwriting, IT and others. When is it relevant? Throughout the analytics lifecycle. What does it do? Aligns expertise and priorities across business functions. What outcome does it create? Faster delivery and higher adoption. Examples Joint underwriting–data science model reviews. What is it? Not a specific role, but any employee that can bridge the communication and understanding gap between analytics and other business units. Also called a “two sport star” — a sports reference to someone who can play more than one sport at a high level. When is it relevant? Throughout the analytics lifecycle. What does it do? Helps different business units to understand things outside of their expertise. Bridges gaps in communication and understanding. What outcome does it create? Better prioritization, more effective analytics, higher adoption, and reduced misinterpretation. Examples Data scientist who can explain model output in business terms; UX designer who can translate an analytics project into user interfaces. What is it? A generic term for an analytics project that an insurer decides to do. Refers to the entirety of the project, from ideation to model creation, implementation, and monitoring. When is it relevant? During design and deployment of analytics use cases. What does it do? Refers to all the different roles and activities for an analytics project as a whole, single initiative. What outcome does it create? Clarity on the cross-functional nature of analytics projects. Examples An effort to revise the personal auto rating plan; claims triage modeling project. What is it? Clear accountability for a specific insurance decision. Specification of who owns a particular decision, who has the right to make that decision, or who has the authority to make that decision. When is it relevant? At every step of the analytics lifecycle. What does it do? Determines who is responsible for a decision and its outcomes. What outcome does it create? Clarity of roles, consistent execution, and measurable accountability. Examples Predictive modelers choosing which analytics technique to use; executives setting analytics priorities. What is it? The steps involved in an analytics initiative, from start to finish. Refers to a defined process that moves through different stages. When is it relevant? Across the full duration of an analytics initiative. What does it do? Clarifies the full process of an analytics project for everyone involved. Coordinates activities that connect data to decisions and outcomes. What outcome does it create? Consistent, efficient analytics execution. Examples Lifecycle stages from objective definition through feedback integration. What is it? The strategic decision on what kinds of risks to write, and in what amounts. When is it relevant? At underwriting, and in portfolio management and capital allocation. What does it do? Specifies the market that the insurer wants to write and limits exposure to loss by limiting how much is written. What outcome does it create? More consistent and stable results. Examples Limiting the amount of property insurance written in hurricane-prone areas. What is it? The process where insurers specify how much of their capital/surplus is used to support the insurance operations for different lines of business and regions. When is it relevant? Development of business priorities and strategies, corporate goals. Also relevant in portfolio management and regulatory review. What does it do? Specifies the capital required to support operations. What outcome does it create? Trust in the financial stability of the insurer. Context for setting corporate goals and strategy. Examples AM Best review of capital adequacy across an insurer’s lines of business. What is it? Any part of the system architecture which moves data from one function or location to another. Typically involves transforming the data structure to be appropriate for the new use. When is it relevant? Through an insurer’s operations. What does it do? Makes data available for specific uses, translates data from one structure to another. What outcome does it create? Access to required data. Examples Creation of analytics-ready datasets from data storage; use of quote data to generate a predictive output, and application of that output in the quoting system. What is it? The documented history of a data source — where it came from, who was responsible for it, and current data definitions. When is it relevant? Any time data is relied on for a business use case. What does it do? Documents the origin and reliability of data. Maintains trust in analytics inputs. What outcome does it create? Reliable analytics outputs. Examples Record of the data flows which feed a data storage; documentation of vendor-provided data. What is it? Predictive modeling techniques that differ in their origins. Statistical models originate in the field of statistics; machine learning models originate in the field of computer science and are one kind of artificial intelligence (AI). The term “machine learning” is more generic than “statistical” and encompasses modern statistical models along with additional techniques. However, specifying both terms provides additional clarity when predictive modeling is referred to in general. When is it relevant? During predictive and prescriptive analytics. What does it do? Creates predictive models that provide not only predictions but the justifications and proof that they are reliable. What outcome does it create? A predictive model. Examples Statistical models (e.g. GLM, GAM), tree-based techniques, gradient boosting machines, random forests, neural networks. What is it? Generic term for employees with the skills to build predictive models. For insurers, this typically refers to actuaries and data scientists. When is it relevant? During model creation. What does it do? Refers generally to employees building predictive models, whether they are data scientists, actuaries, statisticians, or otherwise. What outcome does it create? Efficient terminology. Examples Actuarial modelers, data scientists.
In Motion: The Analytics Process in Insurance
Insurance analytics operates as a structured, continuous operational lifecycle that connects data, decisions, and outcomes across the property and casualty insurance value chain. This lifecycle is designed to support consistent decision-making, maintain analytical reliability, and adapt to changing data and business conditions over time. Each phase contributes to decision quality, governance alignment, and measurable business impact.
To understand the analytics lifecycle, it is helpful to note that its phases span two different cadences of insurance operations. The first is daily operations, where insurance policies are written and managed, claims are adjusted and paid. This is the speed at which the insurance operations happen. It is the cadence at which new data is generated, and also the cadence at which operational analytics must work in order to inform regular business decisions.
The second cadence is outside of daily operations, when analytics projects are considered, prioritized and planned, and when historical data is aggregated and predictive/prescriptive models are built. This gives insurance analytics a periodic nature, even when the application of insurance analytics is done in real time.
The analytics lifecycle moves through both the periodic, strategic creation of predictive models, and the real time operationalizing of predictive information. The stages enable insurers to move from observation to explanation, anticipation, and execution while maintaining transparency and control. Lifecycle discipline supports repeatability, auditability, and sustained performance as analytics capabilities scale across underwriting, claims, pricing, and customer engagement.
Industry guidance emphasizes the importance of lifecycle management and governance practices to ensure analytical models remain accurate, explainable, and aligned with business objectives throughout their use. Structured oversight supports reliability, regulatory confidence, and long-term value realization in analytics-driven insurance operations.
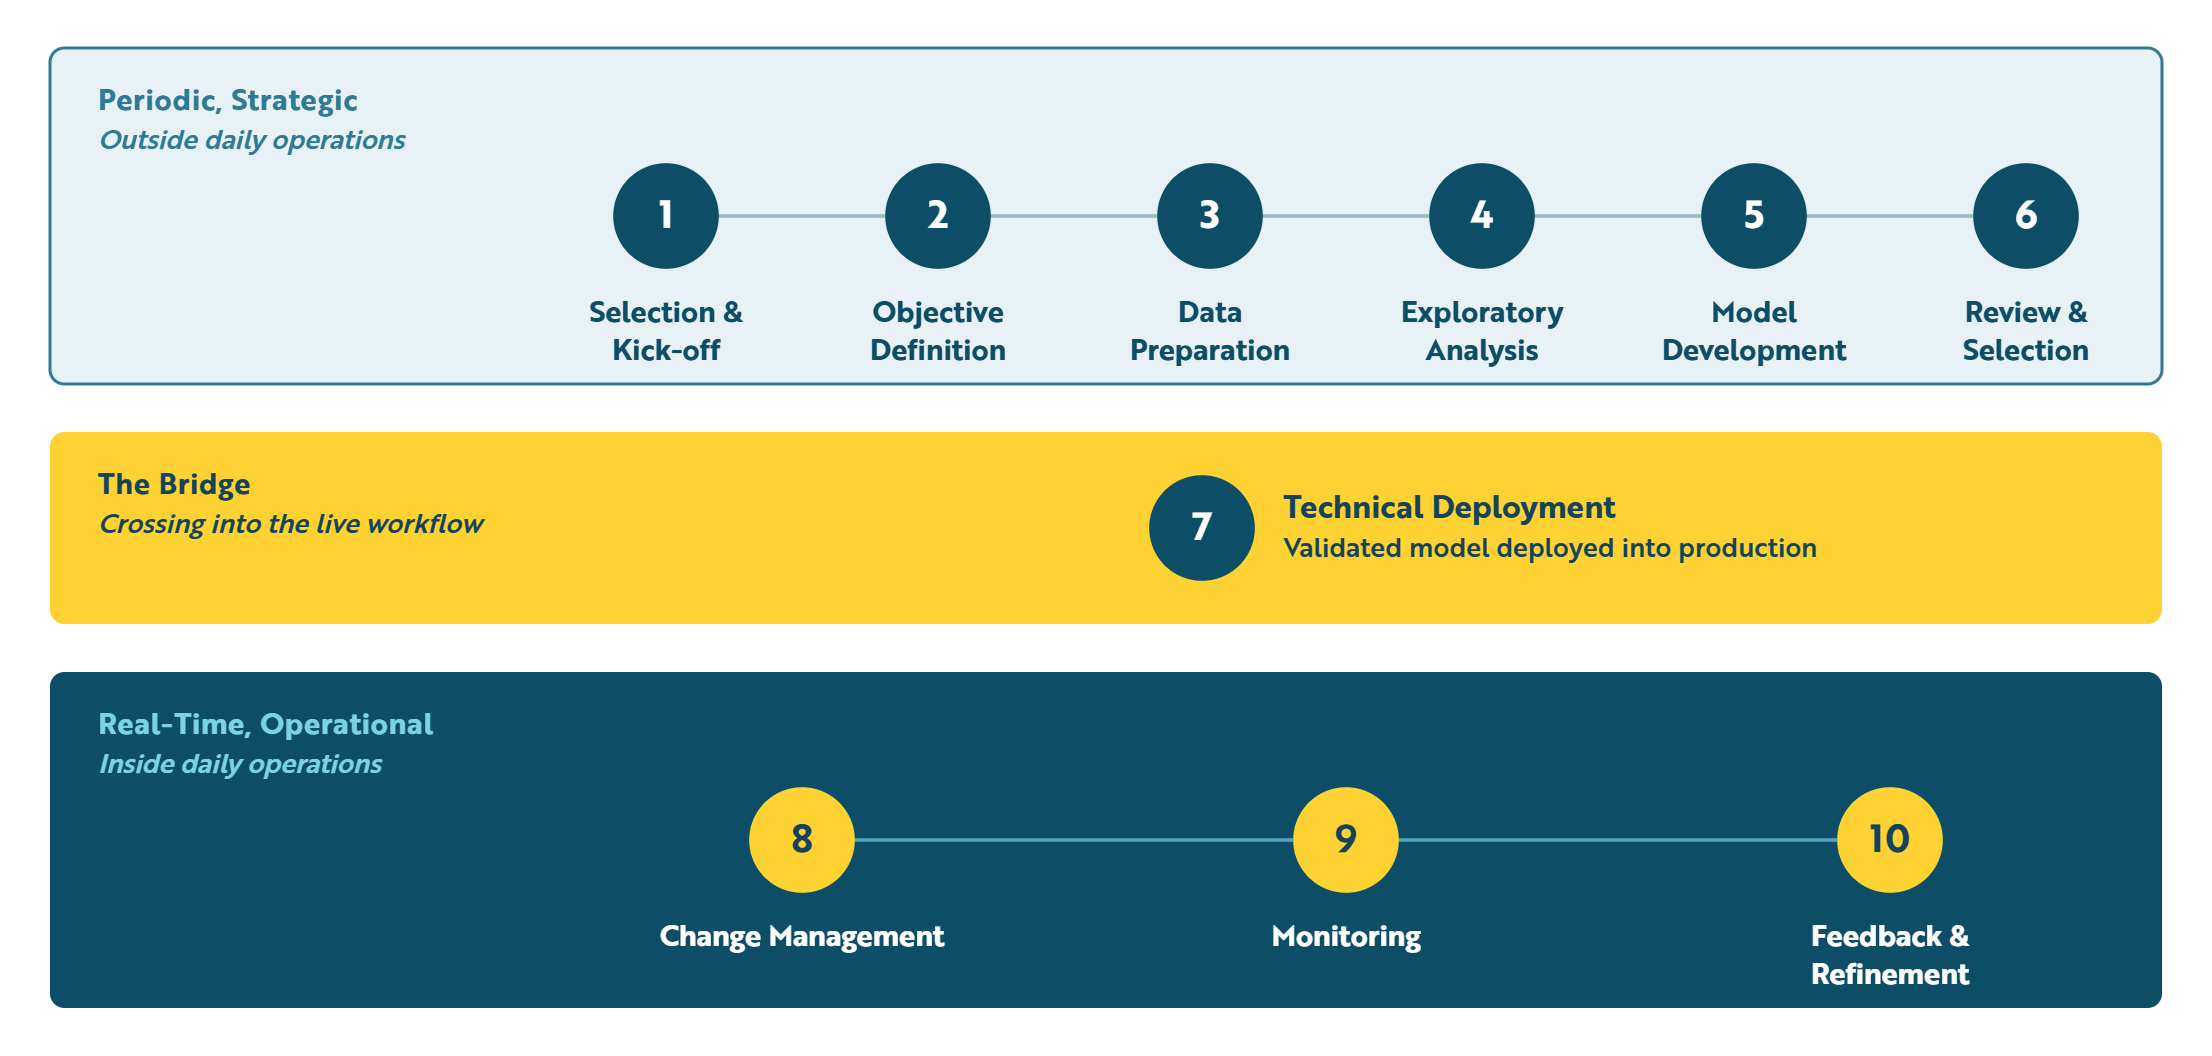
Two Cadences, One Lifecycle
The analytics lifecycle spans two operating tempos. Stages 1–6 happen periodically, outside daily operations. Stages 8–10 run continuously, inside them. Stage 7 is the bridge — the moment a validated model crosses into the live workflow.
Analytics Lifecycle Stages
Note that the Roles discussed in each stage refer directly to the section on Roles and Responsibilities.
1. Selection and Kick-off
Insurance analytics lifecycle begins when an insurer begins a project. However, this necessarily comes after a review of possible projects, prioritization of those projects, and a decision on how to spend resources. The decision to begin an insurance analytics project should align with business goals, and the process should be driven at the executive/business level (see the section on Roles and Responsibilities). This process should also include analytics experts who can advise as to what insurance analytics can and can’t accomplish, as well as the relative efforts involved.
Ideas for possible projects can come from customers or employees, business owners or front-line experts, as well as industry best practices. Descriptive or diagnostic analytics is often used to identify processes or outcomes that could be improved. This stage is not really a part of the lifecycle for any given project, but is a necessary precondition nonetheless.
Decision Roles
- Strategy and Enterprise Accountability
Supporting / Involved Roles
- Business Operations
- Model Research, Development and Maintenance
- Data and Technical Architecture
- Oversight, Governance, and Feedback
2. Objective and Decision Definition
Once a project is kicked-off, the lifecycle begins with clear articulation of the business objective and decision context. This step establishes how analytics will be used, what outcomes are expected, and how success will be measured. Well-defined objectives align analytics initiatives with operational and financial priorities, and clarify what will be needed for implementation, both from a technical side and for change management (i.e. education and training to ensure adoption).
Decision Roles
- Business Operations
Supporting / Involved Roles
- Model Research, Development and Maintenance
- Decision Design and Translation
- Data and Technical Architecture
- Oversight, Governance, and Feedback
3. Data Acquisition and Preparation
Data required to support the defined objective is sourced, integrated, and prepared for analysis. This includes internal insurance data and relevant external data. At this point, the data required is not live, daily-operations data, but rather the stored history of policy transactions and claim payments.
Transactional internal data can be enhanced through two primary means. First, external data from vendors can provide information not collected by the insurer during prior operations. Second, AI techniques based on large language models can turn unstructured insurance data into actionable information for analytics.
Standardization, validation, and governance controls, including verifying and recording the provenance of any data used, ensure data is suitable for analytical use and decision support.
Decision Roles
- Model Research, Development and Maintenance
Supporting / Involved Roles
- Data and Technical Architecture
- Oversight, Governance, and Feedback
- Business Operations
4. Exploratory Analysis and Feature Development
Data is examined to identify patterns, relationships, and variables that influence outcomes. Exploratory analysis informs feature selection and model design by revealing signals relevant to the decision context.
Note that it is important to restrict explanatory data to that which will be known at the time of implementation. For example, a chance of closure model to be generated at the time of quote cannot use any vendor information, such as credit score, that is not ordered until the time of bind.
Decision Roles
- Model Research, Development and Maintenance
Supporting / Involved Roles
- Data and Technical Architecture
- Business Operations
5. Model Development and Validation
Analytical models are developed to estimate outcomes or support decision logic. Statistical and machine learning (AI) techniques are applied in alignment with the defined objective. Collaboration with domain experts ensures analytical outputs reflect operational realities. Models undergo validation to confirm accuracy, robustness, and appropriateness for their intended use.
Decision Roles
- Model Research, Development and Maintenance
Supporting / Involved Roles
- Business Operations
- Oversight, Governance, and Feedback
6. Model Review and Selection
Models developed by the analytical team need to be reviewed and approved by the business owners of the operations to be affected. The expected impact of the model should be discussed, and the possibility of unintended consequences should be considered. The outcome of this review is often more model development and refinements.
When the final model has been selected, the model and all of the material decisions made in its creation should be documented. The review step can also include an internal, but separate, governance committee who reviews the documentation, validation, and appropriateness of the model created.
Decision Roles
- Business Operations
Supporting / Involved Roles
- Oversight, Governance, and Feedback
- Model Research, Development and Maintenance
- Data and Technical Architecture
7. Technical Deployment and Embedded Execution
Validated models are deployed into operational environments where decisions are executed. All of the prior stages in the analytics lifecycle have taken place outside of the scope of daily operations. This phase bridges the gap to daily operations, and subsequent phases are relevant to this real-time cadence as well.
The exact point in the business flow where the modeled information is surfaced should have been decided in phase 1 — Objective and Decision Definition. But this should be reviewed for any changes that have occurred through the process. Decisions about which employees should have access to which pieces of information and at what point in time should be confirmed.
It is also important to determine how the front-line users will interact with the modeled information because decisions made here can impact the technical deployment. For example, the use of large language models as a user interface to the modeled output has different technical requirements than simply exposing modeled output on users’ work screens.
Decision Roles
- Data and Technical Architecture
Supporting / Involved Roles
- Decision Design and Translation
- Business Operations
- Model Research, Development and Maintenance
8. Operational Deployment and Change Management
In order to ensure the new information is used correctly and effectively, the business should implement any education or training required. Employees familiar with the previous workflow will not automatically know what to do when new information is presented or workflows are changed.
Correct information applied incorrectly can not only mute the intended benefit but cause active harm. Again, preparations for this should have been considered in phase 1, but are confirmed and executed during this step.
Decision Roles
- Decision Design and Translation
Supporting / Involved Roles
- Business Operations
- Oversight, Governance, and Feedback
- Model Research, Development and Maintenance
9. Monitoring and Performance Measurement
Deployed analytics are monitored using defined performance indicators. Monitoring provides visibility into predictive accuracy, decision impact, and operational performance as conditions evolve.
Monitoring operates at three levels. At one level it involves the input fields the deployed models rely on in order to detect mix shifts in the data used to create the model. For example, a model created from data with a 90/10 split between renewal and new business may not function correctly if the percentage of new business increases. One advantage of monitoring distributions is that changes can be noticed in real-time through descriptive analytics.
In addition, the prediction of the model should be monitored for accuracy. Depending on the target, this can involve time delays. For example, checking a prediction of a loss metric may require time for losses to be realized and developed.
Finally, the performance metric that should be impacted by the analytics project should be monitored to determine if the new information resulted in changes in performance. For example, did accurate information about claim severity result in better allocation of claims to adjusters resulting in faster claim handling?
Decision Roles
- Business Operations
Supporting / Involved Roles
- Oversight, Governance, and Feedback
- Model Research, Development and Maintenance
10. Feedback and Iterative Refinement
Observed outcomes and performance insights inform updates to objectives, data inputs, or models. When an insurance analytics project becomes operational, it is necessary to monitor the situation and collect feedback. It must be determined that the model appears to be working as intended. Initial feedback from front-line employees using the output of the analytical project can be critical for making necessary adjustments and promoting adoption.
Once adoption has normalized, ongoing feedback and monitoring can point to opportunities for improvement, and also prevents models from becoming stale and ineffective as they age. Operational models will need occasional updates, sometimes as minor refreshes given new data, sometimes as more fundamental rebuilds.
Decision Roles
- Business Operations
Supporting / Involved Roles
- Model Research, Development and Maintenance
- Oversight, Governance, and Feedback
Top Terms to Know in the Analytics Lifecycle
What is it? The steps involved in an analytics initiative, from start to finish. Refers to a defined process that moves through different stages. When is it relevant? Across the full duration of an analytics initiative. What does it do? Clarifies the full process of an analytics project for everyone involved. Coordinates activities that connect data to decisions and outcomes. What outcome does it create? Consistent, efficient analytics execution. Examples Lifecycle stages from objective definition through feedback integration. What is it? The everyday activities of an insurance company. When is it relevant? When considering data creation and acquisition, as well as how an analytics project might be deployed. What does it do? Distinguishes between these activities and other, more periodic activities such as strategy formation, analytics prioritization and portfolio management. What outcome does it create? A defined collection of workflows and activities related to the operation of the insurer. Examples Quote and bind; claims intake and handling. What is it? The disciplined application of the analytics lifecycle to analytics projects. When is it relevant? During any analytics initiative. What does it do? Promotes clarity of roles and decisions. What outcome does it create? Faster and more effective analytics projects. Examples Regular status updates on analytics initiatives; inclusion of appropriate roles at different stages. What is it? Data accumulated by insurers through the regular operations. When is it relevant? When collecting, storing, and analyzing data. Also when deploying predictive models into daily operations. What does it do? Records each change in policy status and each change in claims handling. What outcome does it create? A record of all changes (transactions) for each policy and claim. Examples A change in policy terms, such as deductible; a payment made on a claim. What is it? Transactional data generated by an insurer’s core operational systems. When is it relevant? During underwriting, claims handling, billing, and customer servicing, and during insurance analytics. What does it do? Captures exposure, transactions, and outcomes that inform analytics. What outcome does it create? Visibility into performance, risk selection, and loss drivers. Examples Claim severity histories, policy attributes, payment timelines. What is it? Third-party data sources used to enrich internal insurance data. When is it relevant? At underwriting, pricing, fraud detection, and risk assessment stages, and during insurance analytics. What does it do? Adds contextual signals that are not available from internal systems alone. What outcome does it create? More accurate risk differentiation and better insurance decisions. Examples Property hazard data, weather history, telematics signals. What is it? The documented history of a data source — where it came from, who was responsible for it, and current data definitions. When is it relevant? Any time data is relied on for a business use case. What does it do? Documents the origin and reliability of data. Maintains trust in analytics inputs. What outcome does it create? Reliable analytics outputs. Examples Record of the data flows which feed a data storage; documentation of vendor-provided data. What is it? Assessment of model performance and suitability, typically against data not used in the creation of the model. When is it relevant? Prior to deployment. What does it do? Confirms analytical readiness by providing proof that the model predictions are accurate on data not used to create the model. What outcome does it create? Reliable deployment. Examples Testing model accuracy against historical outcomes. What is it? Predictive modeling techniques that differ in their origins. Statistical models originate in the field of statistics; machine learning models originate in the field of computer science and are one kind of artificial intelligence (AI). The term “machine learning” is more generic than “statistical” and encompasses modern statistical models along with additional techniques. However, specifying both terms provides additional clarity when predictive modeling is referred to in general. When is it relevant? During predictive and prescriptive analytics. What does it do? Creates predictive models that provide not only predictions but the justifications and proof that they are reliable. What outcome does it create? A predictive model. Examples Statistical models (e.g. GLM, GAM), tree-based techniques, gradient boosting machines, random forests, neural networks. What is it? The effect a predictive model has on a measurable business process. When is it relevant? During model deployment and monitoring. What does it do? Changes the decisions made because of the additional information provided by the model. What outcome does it create? Better, more effective business decisions. Examples Implementation of a customer retention model that measurably improved customer retention. What is it? Change in model performance over time as data patterns evolve. When is it relevant? After deployment in production environments. What does it do? Signals the need for recalibration or retraining. What outcome does it create? Maintained decision accuracy. Examples Severity models updated following shifts in claim behavior. What is it? The creation of new predictor variables from transformations of existing data. When is it relevant? During exploratory analysis and model development. What does it do? Shapes analytical performance. What outcome does it create? Improved predictive relevance. Examples Deriving territory definitions from more granular geographic data.
Finding Direction: Challenges and Opportunities in Insurance Data Analytics
Insurance analytics offers significant operational and strategic value for property and casualty insurers. Realizing that value depends on how effectively insurers address a set of structural conditions that shape analytics maturity. These conditions — spanning technology, data, governance, and workforce capabilities — define both the challenges insurers encounter and the opportunities available to those building toward intelligent insurance operations.
Technology and Data Architecture
Challenge
Many insurers operate in environments shaped by fragmented systems, siloed data, inconsistent definitions, and limited real-time integration. These conditions constrain analytics scalability, slow deployment into operational workflows, and introduce variability in insight quality.
Opportunity
Unified data architectures and modern core platforms enable consistent data access, standardized definitions, and timely analytics delivery. When data is readily available across underwriting, claims, and customer interactions, analytics can support decisions with greater speed and reliability — forming a foundational layer for intelligent insurance execution.
Data Quality, Lineage, and Trust
Challenge
Analytics outcomes are directly influenced by data accuracy, completeness, and traceability. Gaps in data quality or unclear lineage reduce confidence in model outputs and limit adoption by business users and regulators. In addition, data needs to be reliably available going forward. Models which rely on vendor data are dependent on those vendors supplying consistent data over time.
Opportunity
Strong data governance, stewardship, and lineage management establish trust in analytics. Reliable, well-documented data enables insurers to apply analytics consistently, explain decisions clearly, and support audit and compliance requirements. This trust is essential for scaling analytics beyond isolated use cases.
Explainability, Fairness, and Regulatory Alignment
Challenge
As analytics and AI are increasingly used in pricing, underwriting, and claims decisions, expectations around explainability, fairness, and accountability continue to shape regulatory scrutiny. Models must support transparency and responsible use throughout their lifecycle.
Opportunity
Designing analytics with explainability and fairness as core requirements allows insurers to embed advanced decisioning confidently within operations. Governance frameworks that integrate documentation, monitoring, and traceability support responsible analytics use and reinforce the credibility of intelligent insurance practices. They also allow for proper auditability and enterprise risk management with respect to an insurer’s use of analytics.
Workforce Capability and Collaboration
Challenge
Analytics programs depend on effective collaboration between technical specialists (in both systems architectures and mathematical modeling) and insurance domain experts. Deficiencies in skill distribution, role clarity, and shared understanding can slow adoption and limit impact. Different and imbalanced engagement from the needed roles can undercut analytics initiatives.
Opportunity
Cross-functional operating models, analytics translators, and targeted capability development align technical expertise with business context. When roles and decision ownership are clearly defined and the various skills gathered into effective teams, analytics insights are more readily translated into consistent operational action.
"Actuaries tend to see their company’s IT department as a consistent blocker for flexible and efficient pricing. But the problem isn’t the people — it’s the legacy systems and processes that are the bane of effective insurance pricing."
Chris Cooksey · Senior Director of Advanced Analytics, Guidewire
From Analytics to Intelligent Insurance
Across these dimensions, the progression from foundational analytics to intelligent insurance reflects increasing system integration and decision maturity. Intelligent insurance emerges when data foundations, analytics capabilities, governance controls, and execution workflows operate as a cohesive system — continuously translating insight into action and refining decisions through feedback. Intelligent insurance is applying the right information at the right time to inform better actions.
Insurers that advance along this path strengthen underwriting precision, claims performance, and customer engagement while maintaining transparency and control. Over time, this integrated approach supports sustained differentiation in risk selection, operational efficiency, and responsiveness to evolving market conditions.
Top Terms to Know in Challenges and Opportunities
What is it? An operating state in which analytics, decision automation, governance, and feedback operate as an integrated system across the insurance lifecycle. It is bringing the right information at the right time in order to improve decisions. When is it relevant? As insurers scale analytics beyond isolated use cases into core operations. What does it do? Continuously translates insight into action while adapting decisions based on outcomes. What outcome does it create? Sustained improvements in underwriting precision, claims performance, and operational efficiency. Examples Analytics-driven claim triage and pricing decisions embedded across core systems. What is it? The degree to which analytics capabilities are integrated, governed, and operationalized. When is it relevant? When evaluating readiness to scale analytics or transition toward intelligent insurance. What does it do? Provides a framework for assessing progress and identifying constraints. What outcome does it create? Clear prioritization of investments and capability development. Examples Moving from reporting dashboards to embedded decisioning. What is it? Integrating analytics output into daily operations such that the output is produced when requested. This makes the information available in “real time”. Note that not all analytics deployments are required to be in real time. When is it relevant? During deployment and monitoring of predictive models. What does it do? Makes analytics information available when it is needed. What outcome does it create? Higher adoption and greater impact. Examples Credit scores available during quoting or binding; claims triage models run at first notice of loss. What is it? The processes and procedures used by insurers in daily operations. These are the processes that can be impacted by analytics initiatives. When is it relevant? During the deployment and adoption of predictive models. What does it do? Makes consistent an insurer’s handling of customer service, policy management, and claims adjustment. What outcome does it create? Consistent and effective daily operations. Examples Activities and tasks created for handling claims. What is it? The same as Data Provenance. It is the documented history of a data source — where it came from, who was responsible for it, and current data definitions. When is it relevant? Any time data is relied on for a business use case. What does it do? Documents the origin and reliability of data. Maintains trust in analytics inputs. What outcome does it create? Reliable analytics outputs. Examples Record of the data flows which feed a data storage; documentation of vendor-provided data. What is it? The ability to understand and communicate how analytics outputs are produced. When is it relevant? In pricing, underwriting, and claims decisions, especially when combined with customer interactions or regulatory review. What does it do? Enables transparency and accountability. What outcome does it create? Regulatory confidence and responsible analytics use. Examples Clear rationale for automated claim routing decisions. What is it? Practices that ensure analytics outputs do not create unintended disparities. When is it relevant? Throughout the analytics lifecycle, particularly in decision automation. What does it do? Aligns analytics with ethical and regulatory expectations. What outcome does it create? Sustainable use of advanced analytics in sensitive decision areas. Examples Monitoring pricing models for disparate impact. What is it? The ability to review and evaluate after the fact. Auditability in analytics requires records of data lineage, documentation of model creation, records of model usage and exception handling, and monitoring of results. When is it relevant? During compliance reviews, internal audits, and regulatory examinations. What does it do? Allows insurers to monitor their own practices and report to regulators when necessary. What outcome does it create? Limited risk from and increased trust in analytics activities. Examples Model documentation; records of approvals during the analytics lifecycle. What is it? The structure of policies, roles, and controls that direct and manage analytics use. When is it relevant? Across the analytics lifecycle from model development through deployment and review. What does it do? Establishes accountability, decision rights, and oversight. What outcome does it create? Consistent and reliable analytics execution. Examples Formal governance committees that approve models before deployment. What is it? Not a specific role, but any employee that can bridge the communication and understanding gap between analytics and other business units. Also called a “two sport star” — a sports reference to someone who can play more than one sport at a high level. When is it relevant? Throughout the analytics lifecycle. What does it do? Helps different business units to understand things outside of their expertise. Bridges gaps in communication and understanding. What outcome does it create? Better prioritization, more effective analytics, higher adoption, and reduced misinterpretation. Examples Data scientist who can explain model output in business terms; UX designer who can translate an analytics project into user interfaces.
Measuring What Matters: KPIs for Insurance Analytics Performance
To realize business value from insurance analytics, insurers must make performance measurable and governable. Key performance indicators (KPIs) serve as control signals that connect analytics outputs to decisions, decisions to outcomes, and outcomes back to continuous improvement. In this role, KPIs do more than report results — they enable accountability, guide intervention, and sustain trust in analytics-driven operations.
Effective KPI frameworks align analytics measurement with both strategic objectives and operational execution. KPIs provide the mechanism through which insurers determine whether analytics is improving underwriting precision, claims performance, customer engagement, and operational efficiency. Deloitte emphasizes that performance management frameworks create value when KPIs are aligned with organizational goals and decision-making priorities, allowing insurers to translate measurement into meaningful performance improvement across the enterprise.
As analytics capabilities mature, KPIs increasingly function as part of the governance layer of intelligent insurance operations. They indicate whether models remain reliable, whether insights are applied consistently, and whether analytics is influencing decisions at scale. Without disciplined KPI frameworks, analytics initiatives lack feedback mechanisms and cannot be managed as enduring operational capabilities.
KPI Categories and Their Role in the Analytics Decision System
Analytics KPIs fall into three broad categories, each corresponding to a distinct aspect of a functioning insurance analytics framework. Examples of specific metrics are discussed but the list is not exhaustive.
| Level | Sub-category | What it answers |
|---|---|---|
| Program | Analytics Investment | Are we getting a return on the analytics investment? |
| Governance & Risk Management | Are we using analytics safely, ethically, and compliantly? | |
| Model | Model Evaluation | Will this model perform reliably when deployed? |
| Ongoing Performance | Is this model still working as conditions change? | |
| Operations | Adoption | Is the model actually being used in daily decisions? |
| Operational Efficiency | Are workflows and processes changing as a result? | |
| Business Outcomes | Are loss ratio, leakage, and retention measurably moving? |
Program-level KPIs
These KPIs track the overall effectiveness of an insurer's analytics program. They help the insurer measure the return for their investment in analytics, and help guide future investment.
Analytics Investment Metrics
Insurer analytics KPIs help the insurer understand, track, and refine their investment in insurance analytics. Some examples include:
- Number of models in production. How many predictive models are operational and what do they impact?
- Rate of model creation. How many models has the insurer been able to develop or revise in a given time frame?
- Rate of model deployment. How many models has the insurer been able to operationalize in a given time frame?
- Business uplift. Incremental value attributable to analytics compared to baseline performance.
- Return on investment. Business uplift relative to the cost of analytics.
These metrics help insurers refine and manage their insurance analytics activities.
Enterprise Governance and Risk Management Metrics
Enterprise-level governance and risk KPIs help the insurer track compliance and manage risk. Some examples include:
- Total program risk. Cumulative risk associated with the use, and possible misuse, of insurance analytics, including model-level checks for bias and fairness.
- Auditability. Completeness of the documentation and compliance of all models in production. Source and verification of all data used to create predictive models.
- Model approval times. For models subject to regulatory review, the speed and consistency of the approval process.
These metrics help the insurer govern and de-risk their insurance analytics activities.
Model-level KPIs
These KPIs operate at the level of individual model performance. They measure the expected quality of the model's performance before implementation, and the effectiveness of the model during its operationalized life-span.
Model Evaluation Metrics
Model evaluation KPIs measure the reliability of predictive insight, protecting decision accuracy before execution. When calculated on hold-out data, these metrics are evidence that the model will perform as advertised and are the basis for model selection. They come in two basic varieties:
- Lift. Does the model effectively discriminate between different outcomes?
- Fit. How well does the model match real-world data?
These metrics ensure that predictive analytics remains aligned with real-world conditions and continues to support valid decisions. They also define the performance expectations that real-world monitoring is compared with.
Ongoing Model Performance Metrics
Ongoing performance KPIs measure whether the predictive model is performing consistently over time. These come in three basic varieties:
- Input distribution. Has the data the model relies on to produce predictions significantly drifted or changed from the historical data used to create it?
- Output distribution. Has the distribution of model predictions remained consistent with expectations?
- Output accuracy. Do the model predictions match observed outcomes?
These metrics indicate whether the predicted model is continuing to operate as intended over time. Indications of problems with model performance should return the use case to the project prioritization process.
Operations-level KPIs
These KPIs track the overall effectiveness of an individual analytics project. They help the insurer determine and track whether operationalized models are having the intended impact.
Model Adoption Metrics
Adoption KPIs measure decision penetration and organizational trust in analytics. They measure whether the analytics information is being used. Some examples include:
- Response time. Time required for the system to return the model prediction.
- Decision impact rate. Share of decisions influenced or automated by analytics.
- Override rate. Frequency with which analytics-driven recommendations are adjusted by users. Indicates a misalignment between model output and business need.
- Training completion. Engagement of front-line users in self-education.
These metrics indicate whether analytics is being operationalized in workflows and how adoption may be improved.
Operational Efficiency Metrics
Operational KPIs measure how effectively analytics is translated into execution within workflows. They answer the question of whether operational workflows are being impacted by model adoption. Some examples include:
- Cycle time reduction. Decrease in processing time for underwriting, quoting, or claims handling.
- Automation rate. Proportion of decisions executed without manual intervention.
- Cost per transaction. Change in average handling cost driven by analytics-enabled decisions.
These metrics reflect the degree to which the use of analytics is impacting operations and delivering benefits.
Business Outcome Metrics
Business outcome KPIs connect analytics directly to financial and customer results. They measure whether changed operational workflows are impacting business outcomes. Some examples include:
- Loss ratio improvement. Impact of analytics on loss cost control and underwriting accuracy.
- Claim leakage reduction. Savings from improved detection of avoidable overpayments or process gaps.
- Retention and churn. Influence of analytics-driven engagement on customer retention.
These metrics validate whether the use of analytics and resulting operational changes are producing measurable value at the portfolio and enterprise level.
"Top-performing companies also regularly track and assess the impact of AA [Advanced Analytics] and invest more than other companies."
McKinsey & Company
Through continuous monitoring and feedback, KPIs enable insurers to recalibrate models, refine governance, and prioritize future use cases. In this way, KPI discipline becomes a defining characteristic of intelligent insurance — where analytics performance is continuously measured, managed, and improved as part of core operations.
Top Terms to Know in Insurance Analytics KPIs
What is it? A quantified signal used to measure the performance of analytics, decisions, or outcomes. When is it relevant? Throughout the analytics lifecycle, from development through execution and review. What does it do? Translates analytical activity into measurable signals for governance and decision-making. What outcome does it create? Visibility in and accountability for analytics-driven performance. Examples Tracking loss ratio improvement attributable to analytics-enabled underwriting. What is it? KPIs used to measure the effectiveness of the overall analytics program, from its costs to its benefits to its risks. When is it relevant? When managing an analytics program. What does it do? Measure the performance and risk of the insurer's analytics efforts. What outcome does it create? Visibility in and accountability for investments made in analytics. Examples Return on investment; number of models in production; time to model approval. What is it? Program-level KPIs that measure the investment in, and return from, insurance analytics. When is it relevant? When managing an analytics program. What does it do? Measure the performance of the insurer's analytics efforts. What outcome does it create? Visibility in and accountability for investments made in analytics. Examples Return on investment; number of models in production. What is it? Program-level KPIs that measure the governance of, and risk from, insurance analytics. When is it relevant? When managing an analytics program. What does it do? Measure the governance activities for insurance analytics and any risks from using analytics in production. What outcome does it create? Visibility in and accountability for the risks involved in analytics. Examples Number of models in production; time to model approval. What is it? KPIs used to measure the validity and expected effectiveness of individual predictive models, and to evaluate them over time. When is it relevant? When evaluating and monitoring a predictive model. What does it do? Measure the expected performance and continued effectiveness of individual predicted models. What outcome does it create? Visibility in and accountability for the validity of predictive models. Examples Lift, fit; model drift. What is it? Measures of how accurate the model is expected to be when deployed. These metrics set the baseline expectations for monitoring. When is it relevant? When evaluating and selecting a predictive model. Before deployment. What does it do? Provides evidence that the model will perform as intended when implemented. What outcome does it create? Confidence to move forward with the model into deployment. Examples Fit and lift, especially on data not used in the model's creation (hold-out or validation data). What is it? Measures of the model's continued relevance over time. When is it relevant? During post-deployment monitoring. What does it do? Identifies problems with the initial deployment, and also when recalibration or retraining is required over time. What outcome does it create? Maintained relevance and reliability of analytics. Examples Shifts in predictor variable distributions; shifts in the distribution of model predictions. What is it? KPIs used to measure the adoption and impact of the analytics initiative. When is it relevant? When monitoring the production use of a predictive model. What does it do? Determines if the predictive model is being used as intended, and what impact it is having on business effectiveness. What outcome does it create? Visibility in and accountability for the use of predictive models. Examples Adoption rate, override rates, change in claim closure times, increase in customer retention rates. What is it? Measures of how widely and consistently analytics is used. When is it relevant? After analytics is deployed into workflows. What does it do? Indicates trust, usability, and organizational alignment. What outcome does it create? Higher return on analytics investment. Examples Frequency of underwriter interaction with predictive scores; override rate. What is it? Measure of changes in behavior, changes in business processes, due to the adoption of analytics. When is it relevant? During execution and performance review. What does it do? Measures if the availability and use of analytics is changing business processes. What outcome does it create? Insight into how effectively analytics is operationalized. Examples Change in the average time a claim is open. What is it? Measures of changes in financial or customer impact. When is it relevant? When assessing the impact and effectiveness of the overall analytics initiative. What does it do? Links analytics activity to business value. What outcome does it create? Evidence-based validation of analytics investment. Justification for scaling or refining analytics initiatives. Examples Change in loss ratio; change in customer retention; reduction of claim leakage.
Staying Aligned: Governance and Compliance in Insurance Analytics
Governance in insurance analytics is the translation of ethical standards into actual practice.
Governance and compliance in insurance analytics provide the control framework that ensures analytical insight is developed and applied responsibly, consistently, and in alignment with both business objectives and regulatory expectations. Governance establishes who makes which decisions, how decisions are documented, and how performance and risk are managed over time. Compliance ensures that analytics operations satisfy regulatory standards, ethical norms, and industry best practices. Together, governance and compliance transform analytics from isolated experiments into repeatable, auditable, and trustworthy systems that support intelligent insurance operations.
Strong governance is a foundational component of analytics maturity because it shapes accountability, risk mitigation, and decision assurance across the analytics lifecycle. As insurers expand their use of predictive and prescriptive models in pricing, underwriting, and claims, governance systems provide consistent oversight that protects both the insurer and policyholders. Research on model governance in the insurance industry emphasizes that robust governance practices are essential not only to reduce risk and support regulatory compliance, but also to maximize the business value of analytical models used in operational and strategic decision-making.
Governance and compliance for insurance analytics encompass multiple interlocking domains. Each domain contributes to trust, control, and continuous improvement, enabling organizations to manage analytics-driven decisions proactively and at scale.
Governance Frameworks and Decision Control
Governance frameworks define the policies, roles, responsibilities, and processes that govern how analytics is developed, deployed, and used. They establish decision rights, documentation standards, and oversight mechanisms that ensure analytics outputs are valid, appropriate, and consistently applied.
Governance frameworks should be written policies officially adopted by the insurer. What is included in the governance framework should consider an insurer's own ethical standards along with regulatory expectations.
- Roles and accountability. Governance assigns clear ownership for model oversight, validation, and decision review across business and technical functions.
- Documentation and traceability. Formal requirements specify how models, data, and analytics-driven decisions are recorded and made auditable.
- Control boundaries. Defined procedures determine when analytics recommendations are automated, reviewed by experts, or escalated for approval.
In addition to these broad expectations, governance frameworks should document the insurer's policies on the following:
Ethical and Responsible Analytics
Governance frameworks embed ethical principles into analytics use, including fairness, explainability, and transparency. Responsible analytics requires insurers to define ethical guardrails, monitor outcomes, and ensure decisions can be understood and justified.
- Fairness monitoring. Evaluates whether model outcomes create unintended disparities.
- Explainability practices. Support communication of analytics-driven decisions to internal and external stakeholders.
- Transparency policies. Govern how analytics assumptions and logic are documented and disclosed.
Ethical governance strengthens trust and aligns analytics use with broader corporate and societal expectations.
Monitoring, Auditability, and Feedback
A mature governance framework includes continuous monitoring and audit mechanisms that track analytics performance, policy adherence, and alignment with strategic goals. These controls provide assurance that analytics continues to operate as intended and supports systematic refinement.
- Performance tracking. Tracking performance against KPI thresholds identifies when governance intervention is required.
- Auditable processes. Ensure that decisions and their analytical basis can be reviewed after the fact.
- Feedback loops. Incorporate operational outcomes into governance updates, reinforcing lifecycle discipline.
These structures turn analytics from a collection of techniques into an operational discipline that supports predictable outcomes across underwriting, claims, and customer operations.
Risk Governance and Model Assurance
Model and data risk are the possible consequences of errors in or misuse of insurance analytics. This risk should be included in the insurer's larger enterprise risk management framework.
Not all insurance analytics projects are of the same risk. Not all incorrect predictions lead to the same consequences. To understand model risk, consider two models: one that guides adjuster assignment and another that predicts coverage applicability for claims. The risk associated with the first model is the assignment of a claim to an inappropriate adjuster, whereas for the second model the risk is that a customer with a legitimate claim could be denied. An error in the first model may lead to a claims process that is not as efficient as it could be. An error in the second model may lead to a lawsuit.
Risk governance ensures that analytics systems operate within defined risk tolerances, adhere to internal policies, and adapt to changing business and data conditions.
- Risk boundaries. Establishes model risk boundaries aligned with organizational risk appetite.
- Review cycles. Defines review cycles, stress testing protocols, and escalation paths.
- Enterprise integration. Integrates analytics risk into broader enterprise risk oversight.
Through these mechanisms, risk governance supports early identification of issues such as model drift, misuse, or misalignment with business intent. Identification of risk can also lead to potential mitigation efforts. Mitigation may not only reduce risk for the insurer on given projects, but could make acceptable analytics projects that would otherwise be outside of the insurer's risk appetite.
Compliance with Regulatory Standards
Compliance in insurance analytics requires adherence to applicable laws, regulations, and supervisory expectations across jurisdictions. These requirements shape how data is used, how decisions are made, and how analytics outputs are explained and defended.
- Decision documentation. Regulatory frameworks often require documentation and justification of analytics-driven decisions in underwriting and claims.
- Data and fairness standards. Standards related to data protection, privacy, and fairness influence model design and operation.
- Supervisory reporting. Supervisory bodies may require reporting, audits, or certification of analytics governance processes.
These compliance guardrails ensure that analytics programs remain legally defensible, transparent, and aligned with supervisory expectations.
"We need to use data not to exclude, but to find a way to say “Yes” safely. We need to explain to regulators — and our customers — why the price is the price. Transparency isn’t just a regulatory requirement; it is the only way to rebuild faith in our industry."
Sean Halverson, Insurance Portfolio Advisor, Guidewire
Through the combination of lifecycle discipline, performance measurement, and governance enforcement, insurers establish the operating conditions required for intelligent insurance. In this state, analytics-driven decisions are executed consistently, monitored continuously, and refined systematically as conditions evolve.
Top Terms to Know in Insurance Analytics Governance
What is it? The structure of policies, roles, and controls that direct and manage analytics use. When is it relevant? Across the analytics lifecycle from model development through deployment and review. What does it do? Establishes accountability, decision rights, and oversight. What outcome does it create? Consistent and reliable analytics execution. Examples Formal governance committees that approve models before deployment. What is it? Defining what roles are responsible for what decisions, and recording those decisions and their justifications for governance and audit. When is it relevant? Throughout the analytics lifecycle, and in audit, compliance, and governance reviews. What does it do? Provides visibility into the decision process. What outcome does it create? Audit readiness and defensible decision rationale. Examples Logs of model versions, data snapshots, and execution outcomes. What is it? The practices and controls that identify, assess, and manage risks associated with analytical models. When is it relevant? When models influence pricing, underwriting, claims decisions, or risk assessment. What does it do? Protects against model failure, drift, and misuse. What outcome does it create? Stable, controlled model performance tied to risk appetite. Examples Documentation of risk assessments of analytics projects; periodic model performance reviews against governance benchmarks. What is it? Adherence to the written analytics governance framework. Also the processes and procedures that ensure this adherence. When is it relevant? Throughout insurance analytics. What does it do? Validates governance alignment and documentation. What outcome does it create? Reduced legal risk and supervisory confidence. Examples Documentation demonstrating fairness testing for pricing models. What is it? Adherence to regulatory standards. Also the processes and procedures that ensure this adherence. When is it relevant? Throughout analytics operations in regulated environments. What does it do? Minimizes compliance risk and supports supervisory reporting. What outcome does it create? Regulatory confidence and operational continuity. Examples Compliance checks against NAIC or Solvency II governance expectations. What is it? Actions taken, in model development or deployment, that lower the potential risk of the analytics initiative. When is it relevant? When high risks can be reduced through reasonable efforts. What does it do? Lowers the chance that an adverse outcome happens. What outcome does it create? Confidence in the use of analytics. Examples Training programs on the proper use of analytics output; exception handling procedures when analytics output is excessive or unusual; revising of predictive models using more socially acceptable predictor variables. What is it? The ability to understand and communicate how analytics outputs are produced. When is it relevant? In pricing, underwriting, and claims decisions, especially when combined with customer interactions or regulatory review. What does it do? Enables transparency and accountability. What outcome does it create? Regulatory confidence and responsible analytics use. Examples Clear rationale for automated claim routing decisions; narrative summaries of model inputs and outputs used in claims triage. What is it? Practices that ensure analytics outputs do not create unintended disparities. When is it relevant? Throughout the analytics lifecycle, particularly in decision automation. What does it do? Aligns analytics with ethical and regulatory expectations. What outcome does it create? Sustainable use of advanced analytics in sensitive decision areas. Examples Monitoring pricing models for disparate impact. What is it? The ability to review and evaluate after the fact. Auditability in analytics requires records of data lineage, documentation of model creation, records of model usage and exception handling, and monitoring of results. When is it relevant? During compliance reviews, internal audits, and regulatory examinations. What does it do? Allows insurers to monitor their own practices and report to regulators when necessary. What outcome does it create? Limited risk from and increased trust in analytics activities. Examples Model documentation; records of approvals during the analytics lifecycle. What is it? The degree to which analytics governance reflects the organization's tolerance for risk. When is it relevant? When establishing governance parameters and control thresholds. What does it do? Ensures analytics operates within acceptable risk boundaries. What outcome does it create? Governance that supports both safety and performance. Examples Governance policies that define acceptable levels of model uncertainty.
Shaping Excellence: Best Practices for Analytics in Insurance
Analytics excellence in insurance is much more than having expert modelers. It is a coordinated set of disciplines that enable data and models to produce trustworthy, repeatable business outcomes. Leading insurers treat analytics as a capability that spans foundational data quality, decision alignment, execution in core workflows, measurement, and organizational enablement. These practices are carried out by different groups but, when coordinated, reinforce one another and support the conditions necessary for intelligent insurance operations, where decisions driven by analytics are consistent, measured, and continuously improved.
Harvard Business Review identifies a persistent gap in how organizations use analytics: many firms generate data without structuring decisions around it, which undermines value realization. To capture business value, firms must align analytics efforts with specific decisions and performance management systems that support causal learning and improvement over time.
This section identifies best practices that help insurers avoid common pitfalls.
Executive Investment
Insurance analytics should be driven by executive-level roles because successful analytics requires multi-disciplinary teams. It is also not cost-free. Without explicit investment in and participation by company executives, insurance analytics is likely to be underfunded.
Executive investment avoids the following pit-falls:
- Expecting results from an isolated team of data scientists and predictive modelers.
- Models sitting on the shelf because deployment was not prioritized or funded.
- Burnout among data scientists and predictive modelers because their work isn't valued and/or they are asked to do tasks they aren't trained for, such as model implementation or monitoring.
Investment in analytics at the executive level ensures that these teams have the resources needed to realize real value. Executive investment is about prioritizing insurance analytics as an activity.
Analytics Prioritization
Closely related to executive investment is a robust process for the prioritization of analytics work. Deciding which analytics project to work on must be anchored in corporate priorities and measurable outcomes rather than abstract optimization. Good prioritization processes focus on return on investment or similar metrics to align with other corporate investments.
An explicit and robust process for the prioritization of analytics projects ensures that high-impact use cases come first and that projects started have clear goals. It also recognizes that the maintenance and updating of existing operational models is part of the work of insurance analytics, and that the effectiveness of a model over time is important.
Proper analytics prioritization avoids the following pit-falls:
- Mis-alignment between the activities of the insurance analytics teams and company priorities.
- Isolated modeling teams creating predictive models that no one is interested in implementing.
- Implemented predictive models being unused or abandoned because the information provided was not useful or never asked for.
- Old operational models of questionable value because no one knows how effective they still are.
"Insurance business leaders often deferred to the experts in R&D when it came to predictive modeling, which proved to be a mistake. The priorities of R&D teams today are all too often misaligned with the vision and priorities of leadership."
Chris Cooksey, Senior Director of Advanced Analytics, Guidewire
A robust prioritization process encourages model monitoring and measuring because the effectiveness of insurance analytics is the primary tool by which value is measured. It ensures that analytics projects are not started unless there is a specific need or goal to be met.
Data Foundations
Insurance analytics depends on decision-ready data and disciplined preparation that links raw data to decisions. Good data foundations lay the groundwork for analytics fidelity. They start with a corporate strategy for how to manage data and make it accessible for different purposes. Good data foundations also include standardized data definitions, documentation of external data use, automated quality checks, and documentation of the provenance of all relied-on data.
Good data foundations avoid the following pit-falls:
- Creation of “data jails” which collect and organize data but make them inaccessible to analytics teams in the format they need.
- Lack of a data dictionary which hampers the understanding and consistent use of available data.
- Paying for external data that may be redundant or otherwise unutilized.
- Unrealized reliance on external data for predictive models or business processes.
Good data is a necessary precondition for insurance analytics. At the same time it is possible for insurers to become too focused on data to the exclusion of funding other analytics priorities. Insurers should look for efficient solutions that solve the problems of making data available and useful.
Efficient Analytics
Also prone to becoming myopic in their work, the data scientists and predictive modelers who analyze data should prioritize efficiency. Rather than building their tools from scratch, model builders should consider existing analytical platforms that provide an array of algorithms, encourage sharing work within a team, and assist with auditability, documentation and peer review.
Analytics efficiency also puts an emphasis on getting to value quickly. This includes making sure to work within the constraints of their use case's requirements, considering, for example, the acceptability of predictor variables and output for regulators, end users, and customers.
Focusing on the efficiency of analytics avoids the following pit-falls:
- Key-person risk where only one person knows the details of or code behind a project.
- Lack of documentation such that choices made during the modeling process are unsupported in retrospect.
- Analysis paralysis where there is always something more to investigate, even though the rest of the company is waiting on a functional model.
- Predictive models with a “poison pill” that make them unacceptable to operationalize.
The vast majority of valuable insurance analytics projects can be completed without resorting to novel algorithmic tools. Insurers are usually better served to have predictive modelers focus on useful models that can be implemented rather than cutting-edge approaches that may prove non-viable.
Operationalizing Analytics
Analytics becomes an operational asset when it informs decisions at the moment of execution and is continuously monitored for relevance. Insurers should put explicit thought and effort into the consistent, repeatable deployment of predictive analytics. This includes the human aspects as well as the technical ones.
Any analytics project that provides value will change some aspect of an insurer's operations, affecting their employees, their customers, or both. Providing ways for people to manage the change is a critical best practice. This may include proper communication and explanations to customers about rate changes, or the training and documentation needed for employees to change how they do their jobs.
A focus on operationalizing analytics effectively avoids the following pit-falls:
- The “swivel chair,” where employees need to access multiple systems or sources to make use of new information, increasing frustration and decreasing acceptance.
- Lack of context or explanation that inhibits user adoption of analytics.
- Misapplication of predictive information due to a lack of guardrails or instruction.
Effective insurers don't underestimate the difficulty in achieving adoption. A good practice is to include a few champions in the model-building process — experienced end users who can communicate the value to their peers. Rolling out new processes as a pilot program with limited impact can also increase adoption by proving the value to the front-line users. Creating a culture where employees feel like they are part of the process encourages them to work with the analytics teams, to provide feedback and to own the end result.
Governance and Compliance
It is easy to see governance and compliance as “extra work.” It can, instead, be seen as a value-add and worth the effort involved. A lack of documentation, where an insurer cannot explain what was done or why, is a critical risk to an insurer's credibility in the eyes of both regulators and their customers. Conversely, insurers that are known to be responsible operators gain the opportunity to try out new processes and procedures that otherwise might be questioned.
Best practices in governance and compliance avoid the following pit-falls:
- Rejected models due to regulatory concerns.
- Market conduct exams and possible penalties due to the lack of (or apparent lack of) diligence in governance.
- Loss of credibility by not being able to answer questions about prior implemented models.
Proper governance is driven by an insurer's own ethical standards and willingness to invest in “doing things the right way.” This attitude toward governance is appreciated by regulators, employees, and customers.
Top Terms to Know in Analytics Best Practices
What is it? Ownership of analytics at the executive level, where not only money, but time and attention, is paid to insurance analytics. When is it relevant? Always. What does it do? Provides company-wide support for the importance of analytics, as well as funding and proper prioritization of projects. What outcome does it create? Insurance analytics that is effective and aligned to corporate goals. Examples Analytics teams reporting to a single insurance executive; representation of analytics at board meetings. What is it? A robust process whereby the insurer evaluates and chooses between different analytics projects. When is it relevant? Continuously, so that an array of projects are ready to be enacted. What does it do? Ensures that analytics projects are actionable and aligned with corporate goals. What outcome does it create? Analytics projects with clear support. Examples Regular meetings to review and prioritize possible analytics initiatives. What is it? A comprehensive and strategic approach to data that prioritizes analytics alongside other business needs. When is it relevant? Before analytics development and deployment. What does it do? Increases the speed and accuracy of analytics initiatives. What outcome does it create? Data that is accurate, standardized, and contextualized for use in operational decisions. Reliable input for predictive and prescriptive models. Examples Data definitions, data pipelines. What is it? Analytics that prioritizes speed and actionable output, while addressing shareability and documentation. When is it relevant? During model creation. What does it do? Focuses predictive modelers on producing results. What outcome does it create? More operational models, decreased key-person risk, and proper documentation and auditability. Examples Platform tools that encourage collaboration on model creation. What is it? The process of turning analytics insights into executed decisions. When is it relevant? During deployment and workflow integration. What does it do? Connects analytics outputs to real-world actions. What outcome does it create? Measurable business impact. Examples Proper training and change management support. What is it? The ongoing application of the governance framework, and adherence to both that framework and regulatory standards. When is it relevant? Throughout insurance analytics. What does it do? Ensures analytics remains aligned with governance policies and regulatory requirements. What outcome does it create? Reduced analytics risk and increased regulatory confidence. Examples Documentation; compliance checks against NAIC or Solvency II governance expectations.
Operating Models: Building and Scaling Insurance Analytics Teams
Analytics performance in property and casualty insurance is shaped by how analytics teams are organized, governed, and integrated into the broader enterprise. Operating models define how analytical capability is developed, how decisions are supported, and how insights move from experimentation into consistent operational use. The structure an insurer adopts influences scalability, execution speed, governance effectiveness, and alignment with business priorities.
As analytics expands in scope and operational impact, informal or ad hoc team structures become insufficient. Increasing model complexity, regulatory oversight, and decision volume require explicit operating models that define accountability, coordination, and execution pathways. An intentional and coherent analytics operating model clarifies and reinforces the roles and responsibilities described earlier. At enterprise scale, analytics performance becomes inseparable from organizational structure.
Effective operating models reflect the insurer's strategic objectives, analytics maturity, and technology environment. As analytics becomes central to underwriting, claims, pricing, and customer engagement decisions, operating models increasingly function as delivery systems for intelligent insurance, connecting data, models, decision ownership, and governance into a coherent structure.
Insurers typically organize analytics capability using one of three dominant operating models. Each model establishes a different relationship between scale, specialization, and business integration.
Centralized Analytics Teams
Centralized analytics teams organize data science and analytics expertise within a dedicated enterprise function, often structured as a center of excellence. This model concentrates analytical capability, promotes standardization, and enables consistent governance across use cases. It centralizes the prioritization of what analytics projects to work on.
- Common methodologies. Centralized teams establish common methodologies, tooling standards, and governance practices that support reliability and compliance.
- Consolidated expertise. Consolidation of expertise enables knowledge sharing and reuse of models, data assets, and analytical frameworks.
- Enterprise visibility. Enterprise visibility into analytics priorities supports alignment with strategic objectives and investment planning.
This operating model supports foundational capability development and consistency across the organization, but can struggle with delivery speed for addressing specific business needs. Centralized analytics teams tend to only prioritize the projects with the widest application, leaving important projects for smaller parts of the company unaddressed. Implementation of analytics projects also strives to be uniform with this model and may not appreciate the differing needs found when applying the same model to different parts of the company.
Embedded Analytics Teams
Embedded analytics teams place analytics professionals directly within business functions such as underwriting, claims, pricing, or product management. This structure emphasizes proximity to operational decision-making and domain context. Project prioritization happens separately within each business function.
This operating model is especially relevant for insurers that have multiple, separate operating entities. For example, some insurers write different lines of business using differently branded corporate entities, perhaps collected over time through acquisitions. This model can also be relevant for global insurers operating within a number of different countries.
- Day-to-day alignment. Embedded teams align analytics work closely with day-to-day business priorities and workflows.
- Domain immersion. Domain immersion improves relevance of models and accelerates insight application within specific functions.
- Iterative refinement. Ongoing interaction with business users supports iterative refinement of analytics use cases.
This operating model strengthens decision alignment by integrating analytics expertise directly into execution environments, but can struggle with differing quality and documentation standards across the company. Staffing these teams with sufficient analytical talent can also be a challenge, increasing the likelihood of key-person risk.
Hybrid Analytics Models
Hybrid operating models combine centralized governance with embedded execution. A central analytics function defines corporate priorities, standards, platforms, and shared services, while distributed teams apply analytics within business domains. Project prioritization is done within the separated teams, as in the embedded model, but with the addition of a centralized voice at the table. This allows for more visibility into the totality of an insurer's analytics activities.
- Central governance. Central governance maintains consistency in data management, model lifecycle controls, and compliance practices.
- Embedded adaptation. Embedded teams adapt analytics to domain-specific needs while operating within enterprise standards.
- Shared platforms. Shared platforms and processes enable coordination, reuse, and scalability.
Hybrid models support analytics maturity by balancing enterprise control with operational relevance. They can be particularly good for global companies and those with multiple operating entities.
"Identifying business challenges and opportunities, and developing and applying predictive models, each requires a different skill set."
Chris Cooksey, Senior Director of Advanced Analytics, Guidewire
Enablers That Sustain Analytics Operating Models
Operating models deliver lasting value when supported by reinforcing disciplines that align leadership, process, and culture. These enablers are arguably more important than the specific operating model chosen.
Analytics Leadership and Sponsorship
Regardless of operating model, executive leadership still establishes direction, corporate priorities, and accountability for analytics programs.
- Clear ownership. Clear ownership at the executive level aligns analytics initiatives with business strategy.
- Sustained sponsorship. Sponsorship supports sustained investment and resolution of cross-functional dependencies.
- Leadership communication. Leadership communication reinforces the role of analytics in decision-making.
Executive leadership remains critical for reinforcing the importance of analytics. In the case of more distributed operating models, corporate funding can make possible analytics teams in business units that lack the operating budget to support one.
Operating Cadence and Delivery Discipline
Structured operating rhythms enable consistent execution across teams.
- Prioritization frameworks. Defined prioritization frameworks align analytics work with business objectives.
- Common KPIs. Common KPIs and reporting mechanisms provide transparency into progress and impact.
- Regular delivery cycles. Regular delivery cycles support predictable movement from prototype to production.
These activities are important in each of the operating models for them to provide value.
Talent and Capability Development
Analytics capability depends on coordinated skill development across roles.
- Diverse roles. Diverse roles such as data scientists, engineers, analysts, translators, and domain experts contribute to analytics outcomes.
- Structured learning paths. Structured learning paths and career progression support retention and expertise growth.
- Interdisciplinary collaboration. Interdisciplinary collaboration strengthens shared understanding and execution quality.
Regardless of operating model, a talent-sharing mindset encourages professional growth and allows analytics professionals to learn from many different perspectives.
Platform and Process Alignment
Technology and process alignment reinforce scalability and governance.
- Shared analytics platforms. Shared analytics platforms support consistent data access and model deployment.
- Model lifecycle processes. Model lifecycle processes enable controlled promotion of analytics into production.
- Collaboration tools. Collaboration tools support coordination across centralized and embedded teams.
Even in the distributed operating models, collaboration and cooperation across business units is beneficial. While distributed models don't encourage this collaboration by virtue of the organizational structure, there is still nothing to prevent it from happening.
Cultural Integration and Enablement / Training
Analytics adoption is reinforced through consistent engagement and reinforcement.
- Early involvement. Early involvement of business users supports relevance and trust.
- Outcome visibility. Visibility into analytics outcomes reinforces value recognition.
- Shared ownership. Shared ownership of success strengthens sustained use.
Whether centralized or distributed, sustained efforts to support adoption is critical.
Operating Models and Intelligent Insurance
Operating models provide the structural foundation through which analytics becomes an enterprise capability. When operating models align analytics expertise, decision ownership, governance controls, and execution workflows, insurers establish the organizational conditions required for intelligent insurance. In this state, analytics-driven decisions are delivered at scale, governed consistently, and refined continuously as business and risk conditions evolve.
Without clear operating models, roles and responsibilities become confused, analytics initiatives lose consistency, governance weakens, and decision impact becomes uneven across the organization.
Top Terms to Know in Analytics Operating Models
What is it? The organizational structure through which analytics capability is developed, governed, and applied. When is it relevant? As analytics expands beyond isolated initiatives into core insurance operations. What does it do? Clarifies roles. Defines how teams coordinate, how decisions are supported, and how analytics moves into production. What outcome does it create? Consistent, scalable analytics execution across the insurer. Examples An insurer defining centralized standards with embedded analytics teams. What is it? An operating model in which analytics expertise is organized within a single enterprise function. When is it relevant? During early or foundational stages of analytics maturity, or when coordination and standards outweigh other considerations. What does it do? Consolidates expertise and enforces standardization. What outcome does it create? Consistent methods, governance, and capability development. Examples A data science center of excellence serving all business units. What is it? An operating model that places analytics professionals within business functions. When is it relevant? When analytics support for frequent, domain-specific operational decisions outweighs other considerations. What does it do? Aligns analytics closely with business context and execution. What outcome does it create? High relevance and faster application of insights. Examples Analytics specialists embedded in claims operations. What is it? An operating model that combines centralized governance with distributed execution. When is it relevant? At advanced stages of analytics maturity. What does it do? Balances enterprise consistency with domain specialization. What outcome does it create? Scalable analytics with local adaptability. Examples Central analytics governance with embedded underwriting teams. What is it? Investment of time, energy, and money in analytics by insurance leadership. When is it relevant? When creating, and executing on, a corporate structure for insurance analytics. What does it do? Provides the direction and resources to create an analytics function. What outcome does it create? An internally coherent analytics operating model that enables consistent, scalable analytics execution across the insurer. Examples Chief Analytics Officer role in an insurer. What is it? The pace at which analytics information needs to be delivered for specific use cases. When is it relevant? When analytics transitions from development to production. What does it do? Clarifies one aspect of how insights become actions. What outcome does it create? Alignment between the business need and analytics delivery. Examples Providing credit scores in real time, when requested during a quote; near-real-time information on portfolio distribution; daily updates of monitoring tools. What is it? The set of processes that govern prioritization, development, and deployment cadence. When is it relevant? Across ongoing analytics operations. What does it do? Coordinates work across teams and initiatives. What outcome does it create? Reliable movement from prototype to production. Examples Defined sprint cycles and release governance for analytics use cases. What is it? The effort to acquire, create, and nurture the skills required for insurance analytics. When is it relevant? When developing and maintaining insurance analytics. What does it do? Provides resources and direction for employee education and career development. What outcome does it create? A talent base within the insurer that can execute on insurance analytics. Examples Formal rotation programs for predictive modelers; internal analytics education webinars. What is it? Ensuring that tools are available to enable insurance analytics at scale. When is it relevant? As analytics initiatives grow in number and complexity. What does it do? Encourages shared work and peer review, as well as documentation and auditability. What outcome does it create? Sustained analytics effectiveness as demand increases. Examples Shared analytics platforms supporting multiple teams. What is it? Creating the environment within the insurer that supports analytics creation and adoption. When is it relevant? As insurance analytics grows into a corporate-wide function. What does it do? Reduces friction and improves execution consistency through knowledge sharing, education, and cultural reinforcement. What outcome does it create? A culture within the insurer that understands and accepts the need for insurance analytics, and that can adopt and use analytics effectively. Examples Training programs for general analytics; enablement sessions for specific analytics projects.
Empowering the Workforce: Data Literacy and Change Management
Analytics capability in property and casualty insurance becomes durable only when it is supported by a workforce that understands how data, models, decisions, and outcomes are connected. Workforce enablement determines whether analytics is interpreted consistently, applied appropriately, and reinforced through daily operational behavior. It therefore functions as the human execution layer of analytics, translating analytical capability into measurable business impact.
As analytics becomes embedded into underwriting, claims, pricing, and customer engagement workflows, workforce readiness shapes adoption, trust, and execution quality. Clear role expectations, shared understanding of analytics intent, and structured reinforcement mechanisms ensure that analytics-driven decisions are applied consistently within defined governance boundaries. Workforce enablement is thus a structural requirement for intelligent insurance operations rather than a supporting activity.
Data Literacy as an Operational Capability
Data literacy in insurance analytics refers to the ability of employees to understand what analytics outputs represent, how they should be interpreted, and when they should influence decisions. This capability is role-specific and decision-oriented. It does not require all employees to understand analytical techniques, but it does require clarity on how analytics informs their responsibilities.
Operational data literacy enables underwriters, claims professionals, and managers to interpret analytics outputs within the context of risk appetite, process constraints, and regulatory expectations. Shared terminology and consistent definitions reduce ambiguity and prevent misapplication of insights. When data literacy is established across functions, analytics outputs are treated as decision inputs with defined intent rather than abstract indicators.
Data literacy reinforces execution quality through several mechanisms:
- Role-specific interpretation. Ensures analytics is applied within appropriate decision boundaries.
- Shared language and definitions. Reduce variation in how analytics is understood across teams.
- Awareness of model intent and limitations. Supports escalation and oversight when required.
These mechanisms ensure analytics supports decisions consistently across the organization.
Role Clarity and Decision Ownership
Workforce effectiveness depends on clear understanding of who is responsible for acting on analytics outputs. Role clarity defines how analytics recommendations intersect with decision authority, escalation paths, and accountability structures. Without explicit decision ownership, analytics recommendations risk inconsistent application or inaction.
Decision ownership establishes responsibility for interpreting analytics, executing actions, and evaluating outcomes. Alignment between analytical roles and operational roles ensures that insights move from analysis into execution within defined governance constraints. Clear escalation paths support review and intervention when analytics outputs conflict with contextual judgment or regulatory requirements. This is a critical part of governance.
Role clarity enables disciplined execution through the following mechanisms:
- Defined ownership. Defined ownership of analytics-informed decisions reinforces accountability.
- Escalation and override pathways. Clear escalation and override pathways support governance and risk control.
- Producer–executor alignment. Alignment between analytics producers and decision executors reduces friction.
These structures ensure analytics contributes to predictable and auditable decision-making. Role clarity also influences operational details in that not everyone in every role needs every piece of information. Decisions for what information to surface at which part of the workflow are driven by decision ownership and role clarity.
Change Management and Adoption Reinforcement
Analytics adoption is sustained through structured change management that prepares the organization for new decision processes and reinforces desired behaviors over time. Change management aligns expectations, builds confidence, and integrates analytics into existing workflows rather than positioning it as a parallel activity.
Effective change management clarifies why analytics is introduced, how it affects decisions, and how success is measured. Training programs support gradual capability development and reduce uncertainty. Feedback mechanisms enable continuous adjustment based on user experience and observed outcomes. Over time, these practices normalize analytics-driven decision-making.
Adoption reinforcement is supported by:
- Clear communication of purpose. Communication of expected outcomes to align stakeholders.
- Progressive training and enablement. Builds confidence and competence over time.
- Project champions and pilot programs. Let selected users of analytics participate in its creation and evaluation.
- Feedback channels. Inform refinement of analytics use and workflow integration.
Allowing selected end users to participate in the creation and evaluation of predictive models lets them become thoroughly familiar with the intent of the project and convinced of the potential value. These people can advise on the best way to deploy the created model, and can champion the adoption of analytics with their peers during the rollout. Similarly, small pilot programs which test the real-world efficacy of analytics can be more effective for long-term adoption than broad, universal rollouts.
All of these practices embed analytics into everyday operations.
Trust, Transparency, and Confidence in Analytics
Trust in analytics develops through repeated, observable alignment between analytics outputs, decision outcomes, and governance oversight. Workforce confidence is shaped by how clearly analytics recommendations can be understood, how consistently they are applied, and how reliably they perform over time. Trust cannot be asserted. It emerges from experience.
Transparency supports this trust by enabling users to understand how analytics informs specific decisions. Explainable analytics outputs, documented assumptions, and clear articulation of model limitations and user decision boundaries allow them to apply recommendations appropriately. Visibility into performance measurement reinforces credibility by demonstrating that analytics behavior is monitored and evaluated.
Consistency further reinforces confidence. Uniform application of analytics across teams signals fairness and reliability. Alignment between analytics recommendations, KPI measurement, and governance action demonstrates that analytics operates within defined constraints and that deviations are addressed systematically.
Workforce trust is reinforced through:
- Explainability in decision context. Supports understanding and appropriate use.
- Visibility into performance measurement. Reinforces credibility and oversight.
- Consistency of application. Strengthens reliability across workflows.
- Clearly defined exception and override procedures. Acknowledge limitations and build trust.
As trust grows, analytics becomes a dependable component of high-impact decisions.
"In our experience, change management represents half the effort required to secure both financial and nonfinancial impact, while efforts to bring clean data to the models, the modeling itself, and the integration of AI account for the other half."
McKinsey & Company
Workforce Enablement and Intelligent Insurance
Workforce enablement connects operating models, analytics lifecycle discipline, KPIs, and governance into observable organizational behavior. When employees understand how analytics informs decisions, how outcomes are measured, and how accountability is enforced, analytics becomes embedded within daily practice.
Through data literacy, role clarity, structured change management, and trust reinforcement, insurers establish the behavioral conditions required for intelligent insurance. In this operating state, analytics-driven decisions are executed consistently, monitored continuously, and refined systematically as conditions evolve. Workforce enablement therefore completes the causal chain from analytical capability to sustained business performance.
Top Terms to Know in Workforce and Change Enablement
What is it? Providing the information, training, and educational opportunities that allow employees to understand, apply, and reinforce analytics-driven decisions. When is it relevant? As analytics becomes embedded into operational workflows. What does it do? Provides the understanding required to consistently apply analytics. What outcome does it create? Reliable execution of analytics-informed decisions. Examples Defined guidelines provided to underwriters when applying predictive risk scores. What is it? The ability to interpret analytics outputs within the context of specific insurance decisions. When is it relevant? At the point where analytics informs underwriting, claims, or pricing actions. What does it do? Reduces ambiguity and misinterpretation of analytics recommendations. What outcome does it create? More consistent and appropriate decision-making. Examples Claims adjusters understanding severity scores and escalation thresholds. What is it? Structured practices that prepare and reinforce adoption of analytics-driven processes. When is it relevant? When introducing or expanding analytics use. What does it do? Aligns expectations, builds confidence, and supports behavioral change. What outcome does it create? Sustained adoption of analytics in daily operations. Examples Training and communication programs supporting new claim triage workflows. What is it? Structured, ongoing actions that encourage consistent use of analytics. When is it relevant? After analytics is deployed into production. What does it do? Stabilizes new behaviors and discourages reversion to prior practices. What outcome does it create? Durable analytics usage. Examples Incorporating analytics usage into performance reviews. What is it? Clear accountability for acting on analytics-informed recommendations. When is it relevant? When analytics outputs trigger operational decisions. What does it do? Defines who executes, reviews, or escalates decisions. What outcome does it create? Accountable and auditable decision execution. Examples Defined ownership for claim routing decisions based on predictive models. What is it? Clear definition of how analytics intersects with individual responsibilities. When is it relevant? During analytics deployment and adoption. What does it do? Prevents gaps or overlaps in decision execution. What outcome does it create? Reduced friction and consistent application of analytics. Examples Clear distinction between analyst recommendations and underwriter authority. What is it? The ability to understand how analytics outputs apply to a specific decision scenario. When is it relevant? At the moment of decision execution. What does it do? Builds confidence and supports appropriate judgment. What outcome does it create? Trustworthy analytics-supported decisions. Examples Clear explanation of why a claim was flagged for special handling. What is it? Formal processes where feedback can be submitted, collected, and transferred to the insurer. This includes feedback from front-line users of analytics, as well as insurer customers. When is it relevant? As analytics is used over time. What does it do? Includes front-line employees in the process of refining analytics initiatives. What outcome does it create? Better models and increased adoption. Examples Capturing a reason for why an underwriter ignored a suggested price adjustment. What is it? Front-line users of analytics who are included in the creation and development of predictive models. When is it relevant? During model development and deployment. What does it do? Includes user feedback in the development process, and builds trust in the final product through a handful of end-users who can communicate their knowledge to peers. What outcome does it create? Increased trust and adoption of an analytics initiative. Examples A few experienced claims adjusters who are involved in the creation of a claims triage model, and who participate in the roll-out plan for deployment. What is it? A roll-out model for analytics that involves a small-scale trial and evaluation before the general deployment. When is it relevant? When there is uncertainty of the best way to apply analytics, or when there is significant resistance to a project. What does it do? Provides feedback and refinement before a general deployment, and then concrete proof that the intended application of analytics will work and provide real benefits. What outcome does it create? Better deployment of analytics results, higher trust, and greater adoption. Examples Deploying a retention model to agents in a certain jurisdiction and collecting feedback prior to its application everywhere.
Looking Ahead: The Future of Predictive and Prescriptive Analytics
Predictive and prescriptive analytics are advancing rapidly, shaped by improvements in data availability, computing power, modeling techniques, and decision support systems. These capabilities transition analytics from retrospective insight and simple forecasting toward adaptive intelligence that informs decisions in real time and anticipates emergent risk patterns. New capabilities in the form of large language models and generative AI open additional possibilities for what data is available and how people interact with information.
Industry research highlights that analytics adoption is highest where organizations embed decision-centric KPIs, feedback loops, and governance into analytics lifecycles, and where emerging capabilities such as real-time scoring and optimization models support business outcomes at scale. According to a survey by McKinsey & Company, insurers that integrate advanced analytics into core operational systems see measurable improvements in loss ratios, expense management, and customer retention, and they are more agile in responding to emerging risk trends.
The future of predictive and prescriptive analytics is shaped by interlocking trends that extend analytical capability and business impact:
1. Large Language Models (LLM) and Generative AI
LLMs are changing the world of work and risk. By providing an understanding of language, LLMs change how people interact with computer systems. AI systems can synthesize unstructured data and provide reasonable summaries. Agentic systems can leverage LLM capabilities to automate repetitive tasks. And the capabilities, the boundaries of what is possible, change each week.
Insurers are working to bring AI into workflows to enhance their human experts.
- Claims handling. Streamlined with easy summaries of a claim's history.
- Underwriting. Enhanced by making a world of information about a risk available to the underwriter.
- Customer interfaces. Human language interfaces and agentic capabilities can assist insureds to get the most out of their insurance.
AI capabilities also increase risk for insurers. Systems designed to improve a customer's experience, such as phone apps which can upload pictures of damage, can also be manipulated by generated images from fraudsters. The future will be a balancing act of efforts to make processes more efficient while retaining human control to prevent blind acceptance of computer-generated outcomes.
2. Augmented Intelligence and Human-Machine Collaboration
Focus will increase on how companies use their human experts and AI systems collaboratively. While this trend is made possible by AI, it aims to take a more holistic look at how to define or re-define how work is done.
Augmented intelligence refers to systems that enhance human decision-making by combining machine recommendation with human judgment. These systems support interpretability, provide rationale for decisions, and enable users to apply domain expertise effectively.
- Interactive dashboards. Provide decision context alongside analytics scores.
- Explanation layers. Clarify why models recommend specific actions.
- Decision support aids. Assist users in evaluating trade-offs and exceptions.
Augmented intelligence fosters confidence and accountability in the use of AI.
3. Real-Time and Streaming Analytics
Real-time analytics interprets data as events occur, enabling immediate decision support, sometimes through AI interfaces. What is new is the increasing prevalence of telematics data, IoT sensors, and digital interactions. Using this information in real time allows insurers to update risk profiles, recommendations, and pricing in operational contexts.
- Pre-claim warnings. Real-time sensor data may allow insurers to warn insureds of impending mechanical failures, thereby preventing a claim rather than just responding.
- Live risk assessment. Informs underwriting decisions at the point of quote.
- Event-driven analytics. Allow insurers to respond to catastrophic events with both pre-event warnings and post-event streamlined response.
Real-time capability produces behavioral responsiveness, making decisions more precise and adaptive.
4. Decision Optimization
Prescriptive analytics recommends choices that maximize defined objectives, such as profitability, loss mitigation, or customer retention. Advanced optimization models consider constraints, trade-offs, and system dynamics to prescribe actions that align with business objectives.
- Pricing optimization. Balances risk selection with competitive positioning where allowed.
- Workforce allocation. Optimizes adjuster assignment and resource utilization.
- Customer engagement. Recommends offers tailored to risk and value profiles.
Optimization models operationalize analytics recommendations into executable actions.
5. Ethical, Responsible, and Transparent AI
As AI capability grows, expectations for ethical oversight, fairness, and transparency grow with it. The future of analytics embeds ethical risk frameworks that ensure analytics outcomes align with regulatory standards and ethical norms.
- Embedded fairness checks. Built into live monitoring systems.
- Explainable models. Support regulatory compliance and stakeholder trust.
- Responsible usage policies. Guide automation thresholds and override pathways.
Ethical frameworks make analytical decisions trustworthy and societally acceptable.
"Address-level hazard intelligence is essential for understanding real risk and pricing accurately in CAT-prone regions."
Chris Folkman, Vice President, Product Management, Guidewire
Analytics and Intelligent Insurance
Large language models and generative AI. Augmented intelligence and real-time analytics. Decision optimization and the ethical use of AI. These trends all reflect our struggle to make ethical use of the new capabilities that continue to emerge.
Large language models alone would be a revolution, but combined with data streamed from live sensors, the possibility of optimizing insurer processes becomes real. Will this optimization always mean automation, or will a human-machine collaboration result in better, safer outcomes? Are there new opportunities for loss prevention and not just loss insurance?
The rational, ethical use of the best parts of these emerging trends will form the basis of intelligent insurance operations in the future, where decisions are guided by continuous inference, adaptive feedback, and measured outcomes.
The future of insurance analytics therefore represents both technical evolution and organizational transformation. Insurers that invest in these capabilities position themselves to respond rapidly to new risk patterns, personalize customer engagement at scale, and sustain performance improvement across underwriting, claims, and customer service.
Top Terms to Know in Advanced Insurance Analytics
What is it? A generative AI (artificial intelligence) model with an understanding of human language that can be interacted with through general language prompts. Also referred to as “foundational models” because of their general-purpose applicability and the fact that they are a key enabler of many AI systems. When is it relevant? When a natural language interaction enhances the delivery or effectiveness of an analytics initiative. What does it do? Responds in natural language to user prompts. What outcome does it create? Easier and more natural interaction with the information the LLM can provide. Examples OpenAI's ChatGPT; Anthropic's Claude. What is it? A form of AI that can generate new content based on user prompts. Though most closely associated with language models, generative AI includes visual and auditory content as well as others. Single models that can handle multiple modes of communication are referred to as “multi-modal.” When is it relevant? When the creation of new content is relevant to insurance analytics. What does it do? Creates something new, such as a summary of claim notes that didn't previously exist. What outcome does it create? AI systems that can respond to new situations and provide new output. Examples Customer service chat bot; claims notes summarizer. What is it? A software system that solves a business problem using AI capabilities. Note that AI systems often include a variety of techniques, many of which do not involve AI, in order to produce something with the required capabilities. When is it relevant? When single AI or predictive models are insufficient on their own to meet the business need. What does it do? Solves a business problem using whatever tools are appropriate. What outcome does it create? AI systems that tailor functionality to business needs. Examples A claims handling workflow that combines simple rules, predictive model information, and a natural language interface. What is it? Systems that support human decision-making with analytical recommendations and explanations. When is it relevant? When human judgment remains central to decisions. What does it do? Combines machine insight with human expertise. What outcome does it create? Better-informed and accountable decisions. Examples Decision support tools that explain why a claim was flagged. What is it? Analytics that processes and evaluates data as events occur. When is it relevant? During time-sensitive insurance decisions. What does it do? Provides insights continuously based on live inputs. What outcome does it create? Faster and more responsive decisions. Examples Dynamic risk assessment during digital quoting. What is it? Continuous flows of data generated by connected systems and devices. When is it relevant? In telematics, IoT, and digital interaction contexts. What does it do? Supplies live signals to analytics systems. What outcome does it create? More current and context-aware insights. Examples Vehicle telematics data feeding usage-based insurance models. What is it? Analytical methods that identify actions that maximize defined objectives under constraints. When is it relevant? In pricing, resource allocation, and portfolio management. What does it do? Balances trade-offs to select optimal actions. What outcome does it create? Improved performance across multiple objectives. Examples Optimizing claims fraud referrals. What is it? Practices that ensure artificial intelligence operates fairly, transparently, and in alignment with ethical norms. When is it relevant? As AI is used in insurance analytics initiatives. What does it do? Constrains AI behavior within acceptable boundaries. What outcome does it create? Trustworthy and compliant analytics use. Examples Fairness monitoring in automated underwriting models.
From Insight to Action: Guidewire Analytics Solutions
Modern property and casualty insurers need more than analytics models — they need outcomes. Guidewire's analytics portfolio is designed to deliver just that: actionable intelligence embedded directly into underwriting, claims, and operational workflows. Unlike bolt-on solutions that require disconnected data processes, Guidewire Analytics works within the Guidewire Cloud Platform, integrating seamlessly with InsuranceSuite applications like PolicyCenter, ClaimCenter, and BillingCenter, as well as InsuranceNow.
At the foundation is the Guidewire Data Platform, a cloud-native infrastructure purpose-built for P&C data. It consolidates policy, billing, and claims data into a unified model, curated for immediate use in dashboards, business reporting, and machine learning.
Guidewire's analytics capabilities are organized across several core applications, each addressing specific needs within the insurance lifecycle:
PricingCenter: Unified Insurance Pricing and Rating
PricingCenter empowers pricing and actuarial teams to build, test, and deploy advanced pricing models, driving sophistication and helping to improve business KPIs such as loss ratios, combined ratios, and conversion rates. This fully integrated pricing and rating solution improves agility and speed-to-market and eliminates the need for expensive, time-consuming custom integrations, as it features a native PolicyCenter connection.
This provides a single source of truth between pricing and rating, which eliminates unnecessary handoffs, delays, and costly errors. This comprehensive solution dramatically accelerates the entire process, putting the power to make critical changes directly into the hands of those who need it most.
Predict: Machine Learning Operationalized
For underwriting and claims business leaders who want to leverage machine learning and predictive modeling to improve risk selection and pricing, claims outcomes, and customer retention, Predict — an advanced P&C-specific machine learning platform — provides an end-to-end solution that empowers insurers to make intelligent, data-driven decisions throughout the insurance lifecycle.
HazardHub: Geospatial Hazard Intelligence
HazardHub is property risk data that helps insurers reduce losses, improve underwriting profitability, and accelerate workflows. With over 1,400+ data points and 50 peril scores for every address, HazardHub delivers the insights needed to enhance risk selection, pricing accuracy, and portfolio management, ultimately leading to better underwriting outcomes.
Cyence: Cyber and Emerging Risk Modeling
Cyence models cyber risk exposure and the financial impact of cyber events, helping carriers and reinsurers evaluate commercial risk portfolios. Insurers, reinsurers, brokers, and MGAs use Cyence for cyber underwriting and portfolio management.
Industry Intel: Operational Models from Aggregated Data
Guidewire Industry Intel uses pooled, anonymized data to create powerful, pre-built predictive scores (Intel) designed to improve business outcomes. Claims Intel models put their predictions to work for insurers, scoring incoming claims to pinpoint the complex ones right from the start. This allows for smarter triage, ensuring the most experienced adjusters are assigned to the cases that need them most.
Embedded Dashboards and Operational Reporting
Across InsuranceSuite, Guidewire delivers curated dashboards and reporting packages that allow business users to track KPIs for underwriting, claims handling, billing, and policy growth. These dashboards run on top of the Guidewire Data Platform and reflect near real-time operational data without requiring manual exports or custom ETL.
What Sets Guidewire Analytics Apart
- Embedded by design. Unlike standalone tools, Guidewire Analytics is natively integrated into the daily workflow of underwriters, adjusters, and managers.
- Built for insurance. The data model, risk scores, and starter models are all tailored to P&C insurance use cases — not generalized.
- Cloud-native and scalable. Designed for Guidewire Cloud Platform, the solution scales securely and supports continuous delivery of analytics innovation.
- Ecosystem ready. Open APIs and the Guidewire Marketplace enable rapid integration with third-party data providers, fraud vendors, and risk scorers.
- Governance and trust. Built-in controls for model versioning, explainability, and auditability ensure analytics comply with regulatory and operational standards.
By bringing together curated data, predictive intelligence, and embedded delivery, Guidewire enables insurers to move from insight to action — reducing time to value while improving decision quality at scale.
Conclusion: Insurance Analytics as a Strategic Advantage
Insurance analytics has become a foundational capability for property and casualty insurers seeking consistent performance, operational resilience, and disciplined growth. Across underwriting, claims, pricing, and customer engagement, analytics provides the mechanism through which data is translated into decisions and decisions are refined through measured outcomes. When applied systematically, analytics increases precision, reduces variability, and supports accountability across the insurance value chain.
The evolution of analytics from reporting and forecasting into embedded, decision-centric systems reflects a broader shift in how insurers operate. Data foundations enable reliable insight. Analytics lifecycles structure how insight is developed, deployed, and maintained. KPIs make performance, adoption, and risk visible. Governance frameworks enforce control, transparency, and compliance. Operating models and workforce enablement translate analytical capability into consistent execution. Each element performs a distinct function, and together they form a coherent operating system for analytics at scale.
Through this integration, insurers establish the conditions required for intelligent insurance operations. They also provide a framework for the effective, ethical incorporation of AI's emerging capabilities. While AI may change what information is available and when, and how the information is surfaced and consumed, insurers' experience with incorporating analytics into new and better workflows will guide how they respond.
In this operating state, analytics-driven decisions are consistently executed within core workflows, monitored through continuous measurement, and governed through defined accountability and oversight. Intelligent insurance emerges when insight, execution, and feedback operate as a closed system that adapts decisions as conditions evolve.
As risk environments grow more complex and expectations for transparency increase, intelligent insurance enables insurers to respond with greater speed, accuracy, and confidence. It supports proactive risk selection, efficient claims handling, and personalized customer engagement while maintaining regulatory alignment and ethical responsibility. These capabilities allow insurers to manage uncertainty with discipline rather than react to it after outcomes are realized.
Insurance analytics therefore represents more than a technical investment. It is an operating model for decision-making at enterprise scale, for incorporating improvements to how the work of insurance is done. When analytics is embedded across the organization and reinforced through measurement, governance, operating models, and workforce behavior, it becomes a durable source of resilience, trust, and competitive differentiation. Intelligent insurance is the result of this disciplined integration, and it defines how leading insurers will operate in the years ahead.
More from Guidewire
This volume is part of Guidewire's ongoing work to support the property and casualty insurance industry with research, frameworks, and practical guidance. Find further reading in our resources library and on the Guidewire blog.
Browse Resources