HazardHub

AI-Driven Intelligence for Today’s Property Underwriting


Get current, comprehensive property risk data and predictive scores that help you underwrite faster and price with precision.


Assess Faster, Price Smarter

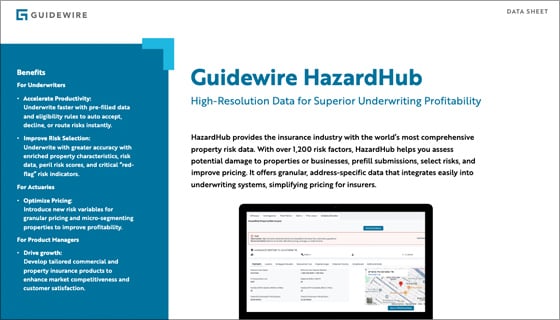
Property underwriting is harder today than ever before. To win, insurers need comprehensive, predictive risk data embedded into their existing workflows.


Get 30x ROI with HazardHub

Lower loss costs and operational expenses with the most current and granular property risk data. 

2 pt

Loss ratio improvement

Use predictive scores to filter out bad risks and decrease the likelihood of future claims.

1.4 pt

Expense ratio reduction

Automate quoting and focus inspections where they add the most value.

7%

Premium growth increase

Write more profitable business by pricing it right from the start.


See Every Peril Risk in Under Two Seconds

Watch how built-in intelligence gives property underwriters the data they need, right where they need it, to make quicker, more accurate calls.


50+ Peril Risk Scores, 1 API Call


Wildfire. Wind. Hail. Flood. Crime. If it can affect a property, it’s here. See the data for yourself below.

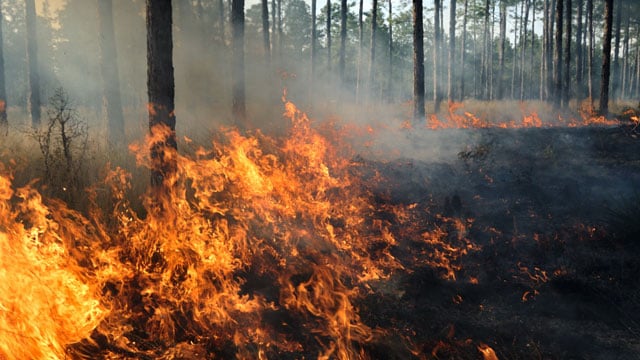
  • Understand a property’s wildfire risk before you make the call. Our Wildfire 3.0 model brings together proprietary data and advanced machine learning techniques, so you can see wildfire exposure in more detail that moves beyond standard US Forest Service data. Key fire risk data includes:

    • Fire Suppression Score: Local response speed and capability rating
    • Fire Hydrant Distance: Ground-truth distance to nearest water source
    • Drive Distance to Station: Routing-based travel time to responding facility
    • Fire Station Staffing: Personnel classification (Career vs. Volunteer)
    • Wildfire Score: Proprietary ML-driven wildfire risk grade
    • WUI Indicator: Indication of property’s distance from wildland-urban interface
    • AAIS Protection Class: Industry-standard 1-10 community safety rating
    • Wildfire Fuel Type: Vegetation analysis surrounding the property
    • Slope & Aspect: Topographical factors accelerating fire spread
    • Hydrant Redundancy: Count of all hydrants within 1,000 feet
    • Burn History: Proximity to historical wildfire perimeters and ignitions
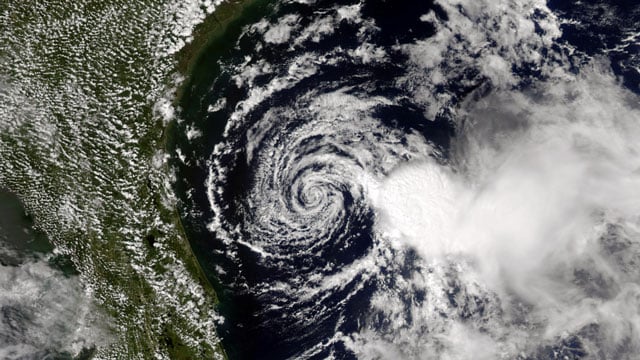
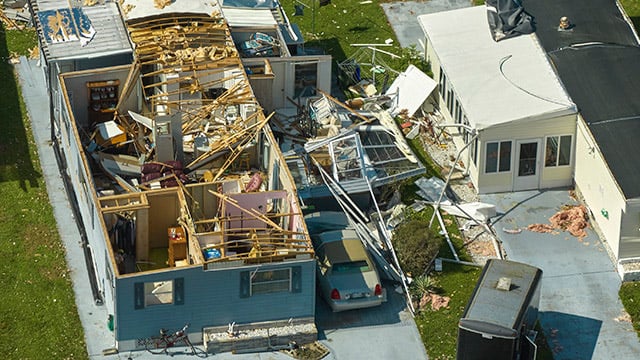
  • Understand the weather risks tied to any address, including how often severe events happen and how exposed the property is today. Key weather risk data includes:

    • Hail Score: Modeled probability of damaging hail events
    • Wind Score: Damaging wind risk with nearest wind incidents
    • Tornado Score: Frequency and severity-based grade for tornadic activity
    • Hurricane Score: Likelihood and intensity of tropical cyclone impacts
    • Max Wind Speed: Historical peak gusts recorded at the specific location
    • Lightning Strike Density: Ground lightning strikes within 10 miles last year
    • Wind-Borne Debris: Risk level for projectile damage during high-wind events
    • Tropical Storm Frequency: Historical recurrence of tropical systems
    • Straight-Line Wind Risk: Vulnerability to non-tornadic wind damage
    • Nearest Hail Incident: Size and date of the closest recorded hail fall
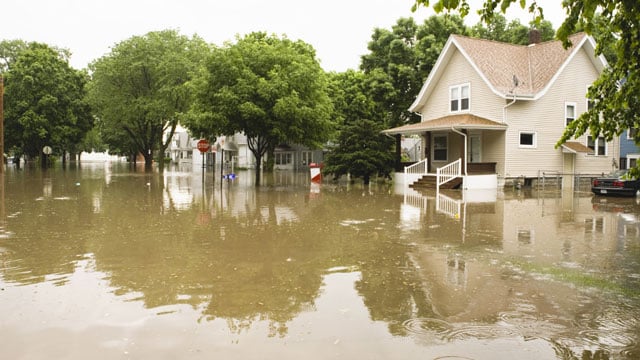
  • Flood zones only tell part of the story. We help you go beyond FEMA maps with a 360-degree view of water risk at the address level, including flooding, storm surge, and interior water damage. Key water risk data includes:

    • Flood Score: Proprietary grades for address-level flood risk
    • Distance to Coast: Proximity to oceanic boundaries for saltwater exposure (beach, coast, and inland waterways) 
    • FEMA Flood Zone: Presence within 100-year or 500-year hazard areas
    • Frozen Pipe Score: Propensity for interior pipe bursts in cold weather
    • Mold Score: Environmental susceptibility for moisture and fungal growth
    • Ice Dam Score: Likelihood of roof damage from freeze-thaw cycles
    • SurgeMAX Score: Vulnerability to storm surge during tropical events
    • Snow Load Score: Maximum weight-bearing requirements for roof integrity
    • Sea Level Rise: Projected inundation risk over 30, 50, and 100 years
    • Coastal Barrier (CBRS): Status for federal flood insurance (NFIP) eligibility
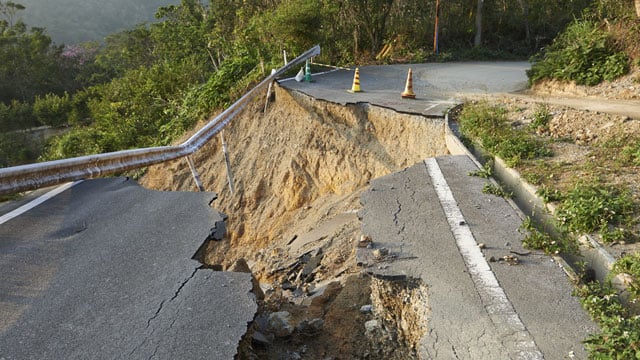
  • See what’s happening beneath the surface before you bind. With address-level insight into seismic, geological, and terrain exposure, you can spot risks more clearly and avoid surprises in your underwriting. Key earth risk data includes:

    • Sinkhole Susceptibility: Likelihood of ground collapse or subsidence
    • Sinkhole Proximity: Distance to nearest recorded sinkhole incident
    • Site Elevation: Absolute height above sea level for terrain analysis
    • Slope & Aspect: Grade and orientation affecting ground stability and fire/flood risk
    • Earthquake Score: Address-level seismic risk grade
    • Modified Mercalli (MMI): Potential shaking severity based on local geology
    • Distance to Fault Line: Precise proximity to known seismic features
    • Radon Gas Exposure: Predicted indoor radon levels based on regional geology
    • Landslide Score: Susceptibility to earth movement and slope failure
    • Soil Composition: Analysis of soil type and foundation stability
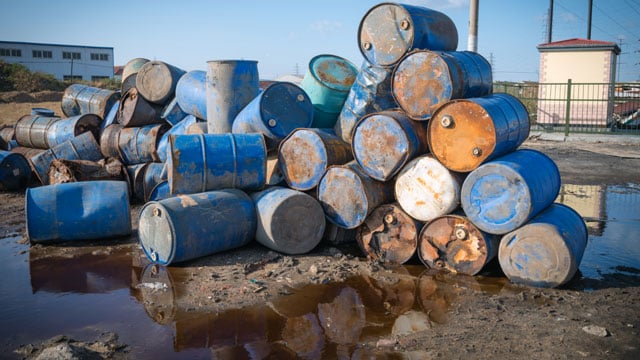
  • Risk isn't always natural. HazardHub tracks thousands of man-made hazards that impact property value, safety, and liability. Key man-made risk data includes:

    • Crime Score: Address-specific ML-driven crime risk grade
    • Property Crime Score: Risk level for burglary, larceny, and motor vehicle theft
    • Violent Crime Score: Risk level for assault, robbery, and homicide
    • Superfund Site Proximity: Distance to EPA-designated cleanup sites
    • Brownfield Proximity: Distance to potentially contaminated land
    • Underground Storage Tanks: Proximity to active or inactive fuel tanks
    • Leaking Underground Tanks: Proximity to leaking storage tanks
    • Nuclear Facility Proximity: Distance to power plants or research reactors
    • Clandestine Drug Labs: Historical record of drug manufacturing on-site
    • Liquor Licenses: Nearby liquor licenses and concentration of them in a radius
    • Traffic Arteries: Proximity to high-volume highways and noise
    • Airport Noise Exposure: Impact from flight paths and engine noise
  • Application estimates aren’t always the full picture. With county assessor data, structural details are verified rather than estimated, giving you a clearer view of property from the start. Key property characteristic data include:

    • Year Built: Original year of construction
    • Square Footage: Total finished living area
    • Construction Type: Primary materials (Wood, Steel, Masonry)
    • Building Condition: Physical state and maintenance level
    • Roof Geometry: Design shape of the roof (Gable, Hip, etc.)
    • Roof Material: Covering type (Shingle, Metal, Tile)
    • Foundation Type: Sub-structure type (Slab, Basement, etc.)
    • Number of Stories: Total vertical floors
    • HVAC System: Primary heating and cooling technology
    • Garage Capacity: Car space count and garage type
  • Ensure every property is Insured to Value (ITV) from day one. Our valuation module lets you use local data to estimate rebuild costs, so you can feel confident you’re not underinsuring. Key replacement cost data includes:

    • Final RCV: Total estimated cost to rebuild the structure
    • Cost per Square Foot: Localized rebuilding rate for the area
    • Debris Removal: Estimated cost to clear site after a loss
    • Architect & Permit Fees: Professional and local government costs
    • Materials & Labor: Detailed parts and labor cost split
    • Contractor Overhead: Typical administrative costs for the region
    • Contractor Profit: Estimated profit margin for reconstruction
    • Construction Quality: Tier of finishes (Economy to Luxury)
    • Physical Shape: Geometric complexity of the building footprint
    • Commercial Cost Ranges: Low, medium, and high-tier estimates
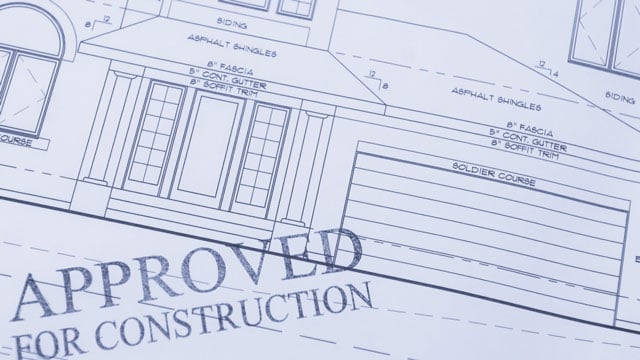
  • Permits give you a reliable, third-party way to confirm property details. With access to our permit library, you can check roof age, flag unapproved additions, and see what major upgrades have been made over time. Key permit data includes:

    • Work Description: Technical scope provided to permitting agencies
    • Number of Permits: Total volume of recorded filings for the property
    • Permit Description: Detailed raw text of performed work
    • Total Valuation: Cumulative dollar value of historical upgrades
    • Permit Type: Work category (Residential, Commercial, Alteration)
    • Permit Issued Date: Official date work was authorized to begin
    • Job Valuation: Estimated cost for an individual project
    • Contractor Name: Professional or company that executed the job
    • Applicant Name: Person or entity who filed the request
    • Owner Name: Property owner at the time of filing


Turn Insight Into Action

Make better decisions with a complete view of property risk across underwriting, pricing, and portfolio management.

  • icon - real estate action - building and pin

    Underwriting

    Instantly determine eligibility. Automate accept / decline / refer decisions.
  • icon - monetization tablet

    Pricing

    Match rate-to-risk with granular risk data and regulatory-approved scores.
  • icon - portfolio management

    Portfolio Management

    Optimize capital deployment by analyzing areas of hidden over/underexposure.
  • icon - social profile click

    Prefill

    Accelerate workflows by pre-populating submissions with 1,200+ individual risk factors.
  • icon - real estate action - house and check

    Inspections

    Prioritize inspections for the highest risk properties. Fast track the low-risk ones.
  • icon - customer relationship management - lead score star

    Lead Scoring

    Find the most profitable customers to target based on their risk profile.

Proven Experience. Earned Trust.

  • logo - MGA Insurance
  • logo - Mountain West Farm Bureau
  • Untitled
  • See What Our Customers Say

    Tuscarora Wayne

    Dan Borges, Tuscarora Wayne
    We use HazardHub to drive our predictive model, to create more accurate pricing down to the risk level - even more so that what we get from the rating bureaus.

    Dan Borges

    CIO

    Watch the Video


    Try HazardHub For Free

    Start a free trial and see the full property risk profile for any US address.

    • Please use your company email when signing up
    • Password 8 Characters Minimum
    • Use a combination of at least one upper case letter, one number, and one symbol
    • Avoid weak passwords and common phrases

      Frequently Asked Questions

    How does HazardHub increase underwriting profitability?
    How accurate is the data provided by HazardHub?
    What types of data does HazardHub use to assess property risks?
    Is HazardHub available as a standalone application?
    Is HazardHub easy to integrate with existing insurance underwriting, brokerage, and claims systems?
    How does HazardHub improve underwriting?
    How does HazardHub improve pricing?
    How can HazardHub improve portfolio management and accumulation?
    Does HazardHub update its data regularly?
    Why is HazardHub better than other property risk data providers?

    More Resources